
Pacific Northwest Index (PNI)
Summary
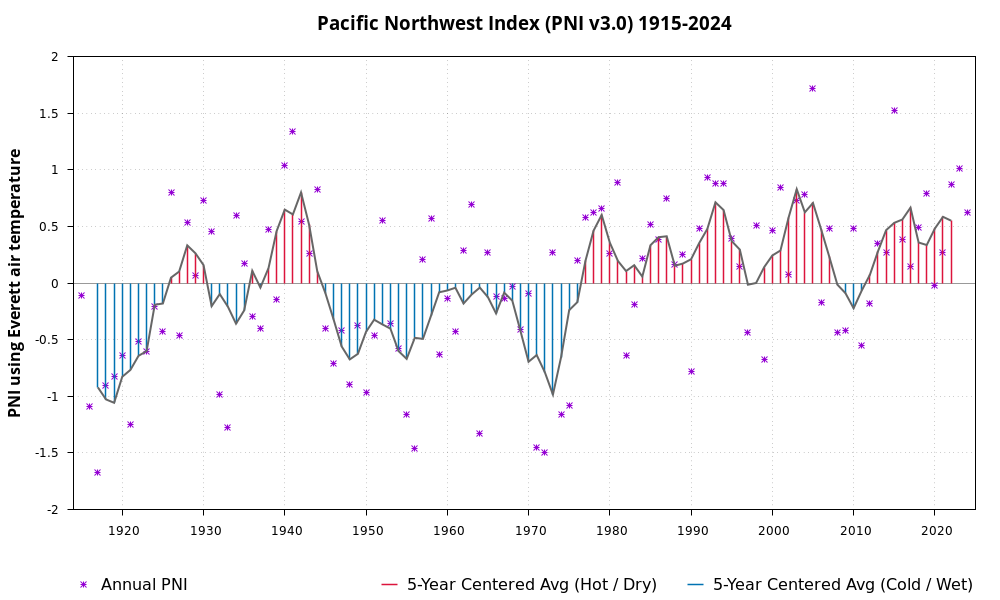
The Pacific Northwest Index (PNI; Ebbesmeyer and Strickland 1995), is an index that is primarily in the coastal region of Washington state. It can be useful for studying climate effects on aquatic species, such as oysters (Ebbesmeyer and Strickland 1995) and salmon (Williams et al. 2014) The PNI is a century-long record, using precipitation, snowpack depth, and air temperature. It thus can be a meaningful composite index of environmental parameters connected through long-distance climate teleconnections and relevant to organisms in the Pacific Northwest. Years with positive values of the PNI are warmer and drier than the historical average and those with negative values are cooler and wetter than the historical average. The PNI v3.0 uses three parameters: 1) annual total precipitation at Cedar Lake, WA in the Cascade Mountains [USC00451233, NCEI]; 2) snowpack depth at Paradise, WA on Mount Rainier on March 15 of each year [USC00456898, NCEI]; and 3) air temperature at Everett, WA [USC00452675, NCEI], averaged annually from daily minimum and maximum data. The current record of the PNI v3.0, which has been applied on DART since February 2025, is reported on this webpage.
Previous applied versions of the PNI on DART are the original version (v1.0) and an alternative PNI (aPNI; in development, Beta v2.0), which respectively used observed and predicted air temperature at Olga, WA in the San Juan Islands. See PNI Methods for more details and archived records.
Table of Values
| Year | Annual Mean Air Temperature (F) Everett, WA | Temperature z-score (mean = 50.977, SD = 1.511) |
Annual Total Precipitation (in.) Cedar Lake, WA | Precipitation z-score (mean = 100.777, SD = 17.229) |
Snowpack on March 15 (in.) Paradise Ranger Station, Mt Rainier, WA | Snowpack z-score (mean = 170.058, SD = 51.566) |
Annual PNI v3.0 | Available Environmental Parameters P=Precip S=Snow T=Temperature |
PNI v3.0 5-Year, Centered Running Average |
|---|---|---|---|---|---|---|---|---|---|
| 2024 | 53.363 | 1.579 | 177.000 | -0.135 | 93.590 | 0.417 | 0.621 | PST | |
| 2023 | 53.117 | 1.417 | 167.000 | 0.059 | 73.960 | 1.556 | 1.011 | PST | |
| 2022 | 53.286 | 1.529 | 150.000 | 0.389 | 88.800 | 0.695 | 0.871 | PST | 0.550 |
| 2021 | 52.266 | 0.853 | 212.000 | -0.813 | 87.530 | 0.769 | 0.269 | PST | 0.584 |
| 2020 | 53.594 | 1.732 | 194.000 | -0.464 | 123.640 | -1.327 | -0.020 | PST | 0.481 |
| 2019 | 52.542 | 1.036 | 158.000 | 0.234 | 81.800 | 1.101 | 0.790 | PST | 0.335 |
| 2018 | 53.713 | 1.811 | 167.000 | 0.059 | 107.450 | -0.387 | 0.494 | PST | 0.358 |
| 2017 | 52.011 | 0.685 | 147.000 | 0.447 | 112.920 | -0.705 | 0.142 | PST | 0.665 |
| 2016 | 54.094 | 2.063 | 201.000 | -0.600 | 106.320 | -0.322 | 0.380 | PST | 0.561 |
| 2015 | 54.686 | 2.455 | 58.000 | 2.173 | 102.010 | -0.072 | 1.519 | PST | 0.531 |
| 2014 | 53.428 | 1.623 | 151.000 | 0.370 | 121.280 | -1.190 | 0.267 | PST | 0.466 |
| 2013 | 51.376 | 0.264 | 162.000 | 0.156 | 90.090 | 0.620 | 0.347 | PST | 0.280 |
| 2012 | 51.462 | 0.321 | 204.000 | -0.658 | 104.330 | -0.206 | -0.181 | PST | 0.072 |
| 2011 | 49.946 | -0.682 | 202.000 | -0.619 | 106.930 | -0.357 | -0.553 | PST | -0.066 |
| 2010 | 52.515 | 1.018 | 141.000 | 0.564 | 103.350 | -0.149 | 0.477 | PST | -0.223 |
| 2009 | 47.719 | -2.156 | 154.000 | 0.311 | 90.840 | 0.577 | -0.423 | PST | -0.090 |
| 2008 | 50.587 | -0.258 | 211.000 | -0.794 | 105.140 | -0.253 | -0.435 | PST | -0.014 |
| 2007 | 51.705 | 0.482 | 142.000 | 0.544 | 93.490 | 0.423 | 0.483 | PST | 0.234 |
| 2006 | 52.556 | 1.045 | 201.000 | -0.600 | 117.390 | -0.964 | -0.173 | PST | 0.474 |
| 2005 | 53.125 | 1.422 | 34.000 | 2.639 | 82.050 | 1.087 | 1.716 | PST | 0.706 |
| 2004 | 53.115 | 1.415 | 168.000 | 0.040 | 85.450 | 0.890 | 0.782 | PST | 0.624 |
| 2003 | 53.171 | 1.452 | 133.000 | 0.719 | 100.700 | 0.004 | 0.725 | PST | 0.828 |
| 2002 | 51.689 | 0.472 | 224.000 | -1.046 | 87.210 | 0.787 | 0.071 | PST | 0.578 |
| 2001 | 51.400 | 0.280 | 102.000 | 1.320 | 84.530 | 0.943 | 0.848 | PST | 0.287 |
| 2000 | 51.552 | 0.381 | 187.000 | -0.329 | 77.640 | 1.343 | 0.465 | PST | 0.243 |
| 1999 | 51.258 | 0.186 | 271.000 | -1.958 | 105.060 | -0.249 | -0.673 | PST | 0.141 |
| 1998 | 53.500 | 1.670 | 166.000 | 0.079 | 104.790 | -0.233 | 0.505 | PST | 0.000 |
| 1997 | 52.722 | 1.155 | 258.000 | -1.705 | 114.060 | -0.771 | -0.441 | PST | -0.015 |
| 1996 | 51.117 | 0.093 | 114.000 | 1.087 | 113.640 | -0.747 | 0.144 | PST | 0.295 |
| 1995 | 52.463 | 0.984 | 167.000 | 0.059 | 98.610 | 0.126 | 0.390 | PST | 0.370 |
| 1994 | 51.994 | 0.673 | 128.000 | 0.816 | 81.200 | 1.136 | 0.875 | PST | 0.644 |
| 1993 | 51.566 | 0.390 | 122.000 | 0.932 | 78.000 | 1.322 | 0.881 | PST | 0.712 |
| 1992 | 52.014 | 0.686 | 119.000 | 0.990 | 81.570 | 1.115 | 0.930 | PST | 0.477 |
| 1991 | 52.916 | 1.284 | 168.000 | 0.040 | 98.520 | 0.131 | 0.485 | PST | 0.353 |
| 1990 | 50.599 | -0.250 | 186.000 | -0.309 | 131.740 | -1.797 | -0.785 | PST | 0.210 |
| 1989 | 51.879 | 0.597 | 179.000 | -0.173 | 95.000 | 0.335 | 0.253 | PST | 0.172 |
| 1988 | 51.092 | 0.076 | 130.000 | 0.777 | 106.910 | -0.356 | 0.166 | PST | 0.152 |
| 1987 | 51.337 | 0.238 | 148.000 | 0.428 | 73.890 | 1.561 | 0.742 | PST | 0.413 |
| 1986 | 51.365 | 0.257 | 114.000 | 1.087 | 103.990 | -0.186 | 0.386 | PST | 0.405 |
| 1985 | 49.585 | -0.921 | 152.000 | 0.350 | 64.280 | 2.118 | 0.516 | PST | 0.333 |
| 1984 | 50.877 | -0.066 | 160.000 | 0.195 | 91.970 | 0.511 | 0.213 | PST | 0.057 |
| 1983 | 50.175 | -0.531 | 164.000 | 0.117 | 103.480 | -0.157 | -0.190 | PST | 0.157 |
| 1982 | 49.733 | -0.823 | 216.000 | -0.891 | 104.400 | -0.210 | -0.641 | PST | 0.106 |
| 1981 | 52.323 | 0.891 | 72.000 | 1.902 | 102.990 | -0.128 | 0.888 | PST | 0.194 |
| 1980 | 51.507 | 0.351 | 160.000 | 0.195 | 96.860 | 0.227 | 0.258 | PST | 0.356 |
| 1979 | 51.578 | 0.398 | 138.000 | 0.622 | 84.370 | 0.952 | 0.657 | PST | 0.601 |
| 1978 | 52.148 | 0.775 | 150.000 | 0.389 | 88.770 | 0.697 | 0.620 | PST | 0.462 |
| 1977 | 51.840 | 0.571 | 112.000 | 1.126 | 99.990 | 0.046 | 0.581 | PST | 0.195 |
| 1976 | 51.809 | 0.551 | 196.000 | -0.503 | 91.480 | 0.540 | 0.196 | PST | -0.169 |
| 1975 | 49.280 | -1.123 | 200.000 | -0.581 | 127.180 | -1.532 | -1.079 | PST | -0.240 |
| 1974 | 50.301 | -0.447 | 268.000 | -1.899 | 120.550 | -1.148 | -1.165 | PST | -0.656 |
| 1973 | 50.103 | -0.578 | 121.000 | 0.951 | 93.300 | 0.434 | 0.269 | PST | -0.985 |
| 1972 | 48.770 | -1.460 | 268.000 | -1.899 | 120.460 | -1.142 | -1.501 | PST | -0.787 |
| 1971 | 49.179 | -1.190 | 271.000 | -1.958 | 121.530 | -1.205 | -1.451 | PST | -0.636 |
| 1970 | 49.300 | -1.110 | 136.000 | 0.660 | 97.600 | 0.184 | -0.088 | PST | -0.695 |
| 1969 | 49.855 | -0.743 | 236.000 | -1.279 | 87.140 | 0.791 | -0.410 | PST | -0.422 |
| 1968 | 49.894 | -0.717 | 102.000 | 1.320 | 112.540 | -0.683 | -0.027 | PST | -0.156 |
| 1967 | 51.330 | 0.234 | 228.000 | -1.124 | 92.470 | 0.482 | -0.136 | PST | -0.085 |
| 1966 | 50.833 | -0.095 | 183.000 | -0.251 | 100.940 | -0.009 | -0.119 | PST | -0.268 |
| 1965 | 50.878 | -0.065 | 171.000 | -0.018 | 85.590 | 0.881 | 0.266 | PST | -0.125 |
| 1964 | 49.061 | -1.268 | 234.000 | -1.240 | 126.160 | -1.473 | -1.327 | PST | -0.040 |
| 1963 | 50.919 | -0.038 | 91.000 | 1.533 | 90.740 | 0.583 | 0.693 | PST | -0.101 |
| 1962 | 50.588 | -0.258 | 152.000 | 0.350 | 87.620 | 0.764 | 0.285 | PST | -0.181 |
| 1961 | 51.141 | 0.109 | 210.000 | -0.775 | 111.230 | -0.607 | -0.424 | PST | -0.042 |
| 1960 | 50.173 | -0.532 | 156.000 | 0.273 | 103.170 | -0.139 | -0.133 | PST | -0.066 |
| 1959 | 50.333 | -0.426 | 177.000 | -0.135 | 123.690 | -1.330 | -0.630 | PST | -0.082 |
| 1958 | 53.610 | 1.743 | 163.000 | 0.137 | 103.640 | -0.166 | 0.571 | PST | -0.289 |
| 1957 | 51.041 | 0.043 | 184.000 | -0.270 | 86.160 | 0.848 | 0.207 | PST | -0.494 |
| 1956 | 50.005 | -0.643 | 357.000 | -3.625 | 102.610 | -0.106 | -1.458 | PST | -0.484 |
| 1955 | 48.638 | -1.548 | 201.000 | -0.600 | 123.600 | -1.325 | -1.158 | PST | -0.670 |
| 1954 | 49.811 | -0.772 | 210.000 | -0.775 | 104.230 | -0.200 | -0.582 | PST | -0.601 |
| 1953 | 51.894 | 0.607 | 167.000 | 0.059 | 130.800 | -1.743 | -0.359 | PST | -0.403 |
| 1952 | 50.108 | -0.575 | 62.360 | 2.230 | 0.552 | PT | -0.365 | ||
| 1951 | 49.496 | -0.980 | 198.000 | -0.542 | 98.690 | 0.121 | -0.467 | PST | -0.324 |
| 1950 | 49.268 | -1.131 | 131.410 | -1.778 | -0.970 | PT | -0.431 | ||
| 1949 | 49.227 | -1.158 | 100.220 | 0.032 | -0.375 | PT | -0.625 | ||
| 1948 | 49.585 | -0.921 | 198.000 | -0.542 | 121.800 | -1.220 | -0.894 | PST | -0.675 |
| 1947 | 50.671 | -0.202 | 185.000 | -0.290 | 114.020 | -0.769 | -0.420 | PST | -0.560 |
| 1946 | 50.492 | -0.321 | 231.000 | -1.182 | 111.750 | -0.637 | -0.713 | PST | -0.320 |
| 1945 | 50.605 | -0.246 | 148.000 | 0.428 | 124.480 | -1.376 | -0.398 | PST | -0.090 |
| 1944 | 50.967 | -0.006 | 105.000 | 1.262 | 79.640 | 1.227 | 0.827 | PST | 0.103 |
| 1943 | 50.203 | -0.512 | 163.000 | 0.137 | 81.060 | 1.144 | 0.256 | PST | 0.513 |
| 1942 | 51.337 | 0.238 | 105.000 | 1.262 | 98.540 | 0.130 | 0.543 | PST | 0.799 |
| 1941 | 52.760 | 1.180 | 81.000 | 1.727 | 81.860 | 1.098 | 1.335 | PST | 0.606 |
| 1940 | 52.561 | 1.049 | 116.000 | 1.048 | 83.390 | 1.009 | 1.035 | PST | 0.648 |
| 1939 | 51.504 | 0.349 | 228.000 | -1.124 | 94.780 | 0.348 | -0.142 | PST | 0.459 |
| 1938 | 50.693 | -0.188 | 147.000 | 0.447 | 81.010 | 1.147 | 0.469 | PST | 0.132 |
| 1937 | 50.140 | -0.554 | 162.000 | 0.156 | 114.780 | -0.813 | -0.403 | PST | -0.040 |
| 1936 | 50.216 | -0.503 | 196.000 | -0.503 | 98.860 | 0.111 | -0.298 | PST | 0.107 |
| 1935 | 49.617 | -0.900 | 159.000 | 0.214 | 79.960 | 1.208 | 0.174 | PST | -0.242 |
| 1934 | 52.637 | 1.099 | 100.000 | 1.359 | 112.330 | -0.671 | 0.596 | PST | -0.359 |
| 1933 | 49.813 | -0.770 | 216.000 | -0.891 | 138.310 | -2.178 | -1.280 | PST | -0.209 |
| 1932 | 50.216 | -0.503 | 200.000 | -0.581 | 133.130 | -1.878 | -0.987 | PST | -0.098 |
| 1931 | 51.246 | 0.178 | 102.000 | 1.320 | 103.180 | -0.139 | 0.453 | PST | -0.204 |
| 1930 | 49.658 | -0.873 | 101.000 | 1.339 | 71.130 | 1.721 | 0.729 | PST | 0.159 |
| 1929 | 48.886 | -1.384 | 172.000 | -0.038 | 72.980 | 1.613 | 0.064 | PST | 0.263 |
| 1928 | 50.906 | -0.047 | 126.000 | 0.854 | 87.060 | 0.796 | 0.535 | PST | 0.332 |
| 1927 | 50.554 | -0.280 | 198.000 | -0.542 | 110.670 | -0.574 | -0.465 | PST | 0.101 |
| 1926 | 51.869 | 0.590 | 110.000 | 1.165 | 89.690 | 0.643 | 0.800 | PST | 0.047 |
| 1925 | 50.896 | -0.054 | 264.000 | -1.822 | 90.600 | 0.591 | -0.428 | PST | -0.181 |
| 1924 | 49.690 | -0.852 | 168.000 | 0.040 | 97.320 | 0.201 | -0.204 | PST | -0.192 |
| 1923 | 49.990 | -0.653 | 232.000 | -1.201 | 100.210 | 0.033 | -0.607 | PST | -0.601 |
| 1922 | 48.322 | -1.757 | 184.000 | -0.270 | 92.750 | 0.466 | -0.521 | PST | -0.643 |
| 1921 | 49.067 | -1.264 | 216.000 | -0.891 | 128.000 | -1.580 | -1.245 | PST | -0.768 |
| 1920 | 49.133 | -1.221 | 136.000 | 0.660 | 124.200 | -1.359 | -0.640 | PST | -0.828 |
| 1919 | 48.170 | -1.857 | 111.450 | -0.619 | -0.826 | PT | -1.058 | ||
| 1918 | 48.630 | -1.553 | 180.000 | -0.193 | 117.630 | -0.978 | -0.908 | PST | -1.028 |
| 1917 | 48.278 | -1.786 | 236.000 | -1.279 | 134.300 | -1.946 | -1.670 | PST | -0.921 |
| 1916 | 47.208 | -2.494 | 114.390 | -0.790 | -1.095 | PT | |||
| 1915 | 50.469 | -0.336 | 100.560 | 0.013 | -0.108 | PT | |||
| 1914 | 92.250 | 0.495 | P | ||||||
| 1913 | |||||||||
| 1912 | 102.400 | -0.094 | P | ||||||
| 1911 | 91.850 | 0.518 | P | ||||||
| 1910 | 116.750 | -0.927 | P | ||||||
| 1909 | 102.280 | -0.087 | P | ||||||
| 1908 | 116.860 | -0.933 | P | ||||||
| 1907 | 84.740 | 0.931 | P | ||||||
| 1906 | 132.010 | -1.813 | P | ||||||
| 1905 | 113.640 | -0.747 | P | ||||||
| 1904 | |||||||||
| 1903 | |||||||||
| 1902 | |||||||||
| 1901 | |||||||||
| 1900 | |||||||||
| 1899 | 114.450 | -0.794 | P |