
The PNI is a mean of three environmental parameters: annual total precipitation, snowpack depth on March 15th, and annual mean air temperature (Ebbesmeyer and Strickland 1995), with each of the three environmental parameters scaled to a mean of 0 and 1 standard deviation.
Slightly different methods of the PNI have been applied on DART through the years because of data gaps and discontinued stations. We describe three different flavors of the methods that have been applied on DART: 1) Original PNI [v1.0 and v1.1]; 2) Alternative PNI [aPNI; Beta v2.0] that uses dynamic factor analysis to help predict missing air temperature at Olga, WA; and 3) Updated PNI [v3.0], which replaces air temperature at Olga, WA with that at Everett, WA.
The current record of PNI that is reported on the PNI webpage is PNI v3.0. The previous records of PNI that have been published on DART are archived below. We include some comparisons and interpretations of the different versions of PNI.
Methods for calculating PNI on DART through the years
Original PNI (v1.0 and v1.1)
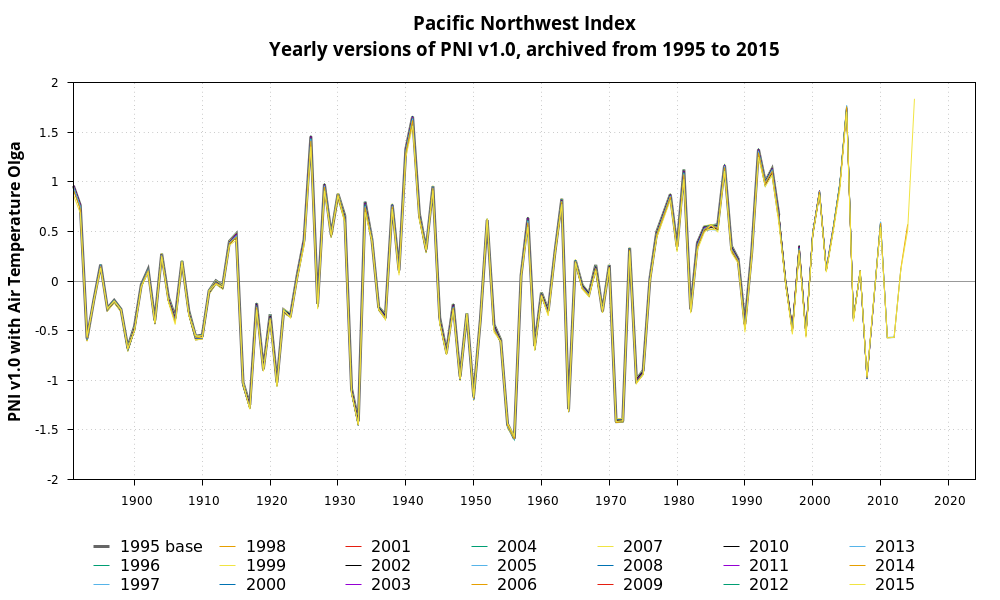
The original PNI was calculated following the method in Ebbesmeyer and Strickland (1995) for the annual index in years 1891-2015 (and the 5-year average PNI in years 1893-2013). We applied PNI v1.0 from mid-2000s to 2016 for reporting on DART. An updated version of the PNI with QCed data conducted in 2025 is also available and is referred to as PNI v1.1.
The PNI v1.0 and v1.1 uses three parameters: 1) annual total precipitation at Cedar Lake, WA in the Cascade Mountains [USC00451233, NCEI]; 2) snowpack depth at Paradise, WA on Mount Rainier on March 15 of each year [USC00456898, NCEI]; and 3) annual mean air temperature at Olga, WA in the San Juan Islands [USC00456096, NCEI].
The annual PNI for year y is calculated as follows:
Please note that the sign of the normalized air temperature data is reversed to align with precipitation and snowpack in their positive or negative effects on organisms. We report the equations above as documented on DART since the mid-2000s. For further breakdown of steps to the calculations, see the section on Updated PNI v3.0.
For PNI v1.0 and v1.1, when there were any missing data, the PNI was still calculated using only two out of the three values of precipitation (P), snowpack (S), and air temperature (T), or even just one out of the three environmental parameters. For data quality purposes, we note whether all three environmental parameters are used (i.e., PST), two of the three environmental parameters are used (i.e., PS, PT, or ST), or one out of the three are used (i.e., P, S, or T).
Alternative PNI (aPNI; Beta v2.0)
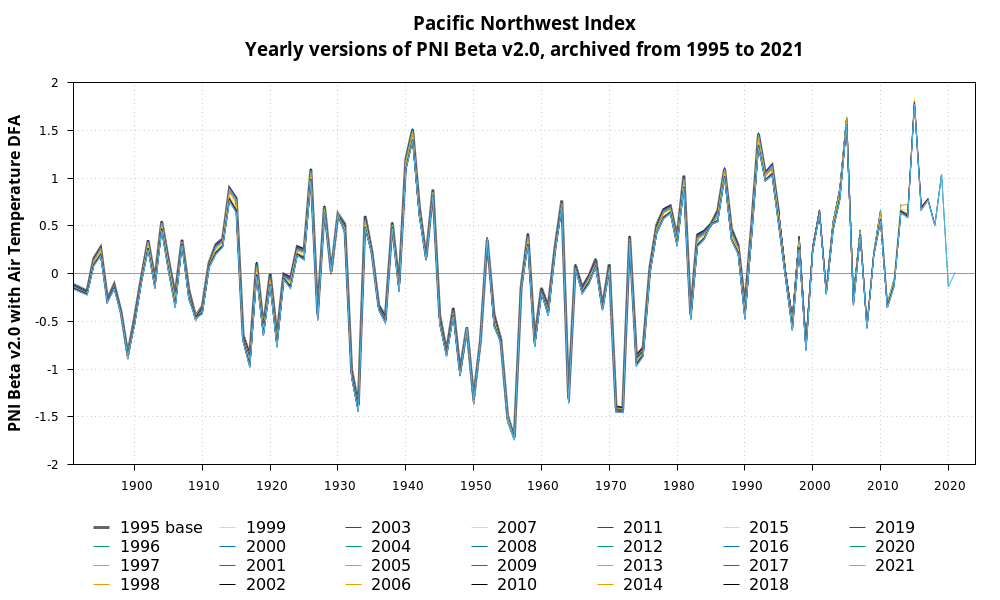
The annual aPNI was calculated for years 1891-2021 (and 5-year average aPNI for years 1893-2019). We applied this method on DART because air temperature stopped being observed at station Olga 2 SE, WA (USC00456096, NCEI) after 2016-04-30. We applied a dynamic factor analysis (DFA) to predict temperatures at Olga, WA (Van Holmes and Gosselin 2020) starting in 2020. However, additional data gaps at the stations used in the DFA prevented the continuation of this method starting in 2022. Please note that this method is in development and a new selection of stations to replace discontinued stations is pending for the DFA analysis to predict temperatures at Olga, WA.
For PNI Beta v2.0, when there were any missing data, the PNI was still calculated using the data available (e.g., PS, PT, ST, P, S, or T).
Updated PNI (v3.0)
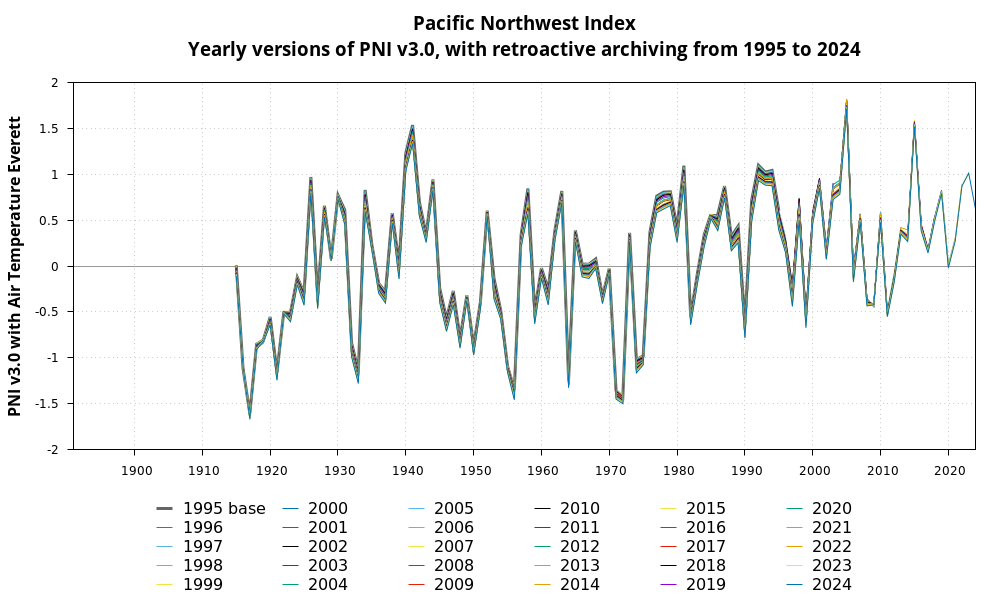
The PNI v3.0 was calculated starting in 2025 with a similar method to that of PNI v1.0, but using air temperature at Everett, WA (USC00452675, NCEI) instead of at Olga, WA (USC00456096, NCEI). The PNI v3.0 record begins in 1915 and is the current method updated annually on DART.
The PNI v3.0
is calculated as follows:
(Please note that these equations are equivalent to the simplified calculations
in Eq.1.)
where , , are respectively the normalized data (i.e., scaled to a mean of 0 and 1 standard deviation; also known as z-scored data). The z-scored data are calculated as follows:
where py, sy, ty are respectively the annual total precipitation at Cedar Lake, the snowpack depth at Paradise, Mount Rainier on March 15, and the annual mean air temperature at Everett, WA in year y. The time series mean (μ) and standard deviation (σ) for each of the three environmental parameters are calculated from the most complete time series possible. Thus, the means ( μP, μS, and μT) and standard deviations ( σP, σS, and σT) are recalculated with new data each year (see Table 3). Please note that the data for total precipitation and snowpack depth are reversed (negative sign in Eq. 3.1 and 3.2) to align with the direction of effects of temperature on organisms. For clarity, the means are calculated as follows:
where NP, NS, NT are respectively the sample sizes (i.e, number of years of data) available for annual precipitation, snowpack depth, and air temperature.
For PNI v3.0, if two environmental parameters are available, we still calculate it using the data available (e.g., PS, PT, or ST). If only one of the environmental parameters is available, then we do not calculate the PNI and note which one environmental parameter was available (i.e., P, S, or T).
Updates to the data
As part of developing PNI v3.0, a new quality control process was established and the historical data were re-examined. The updates applied to the historical data sets, as of February 2025, are summarized below.
- Annual Total
Precipitation at Cedar Lake station, WA:
- For years 1900, 1903, 1904, and 1913, there is not enough data from the Cedar Lake site to obtain an accurate estimate of the annual total precipitation. These years are left as null.
- For years 1929 and 1930, historical data is slightly different than the data used to calculate PNI v1.0 and aPNI (Beta v2.0); after further investigation, the current data reported for station USC00451233 from NCEI appears more accurate and is thus used in the updated data set.
- For the year 2017, data used to previously calculate the annual total precipitation was incomplete and has been corrected.
- For the year 2021, data used to calculate the annual total precipitation was from Mount Rainier station. The data for 2021 has been corrected to precipitation data from Cedar Lake, WA.
- Snowpack
Depth on March 15th at Paradise station, Mount Rainier, WA:
- For years 1916 and 1919, there is not enough data from the Paradise station to obtain an accurate estimate of the snowpack depth on March 15th. These years are left as null.
- For years 1925 and 1937, the data for snowpack depth on March 15th that was previously obtained and used to calculate PNI v1.0 and aPNI (Beta v2.0) does not match the historical data currently reported by NCEI at station USC00456898. After investigation, current data appears to be more accurate and are used in the updated data set.
- For years 1927, 1953, 1954, 2007, 2012, 2015, and 2023, there is no snowpack depth measurement on the date of March 15th, however, there are measurements within a week before and after that. We used these data for linear interpolation to estimate the daily snowpack depth and the value on March 15th. These calculations were checked and match the estimates used for calculating PNI v1.0 in all of these years, except for 1953, which has now been updated.
- For the year 1948, no data on snowpack depth was recorded from March 1 until June 1. Given the large data gap, a linear interpolation was not applied. Instead, we used the maximum snowpack depth in February as a surrogate estimate for the March 15th in the calculations of PNI v1.0 and aPNI (Beta v2.0) and we maintain this rule for PNI v3.0.
Comparisons of versions of PNI and yearly recalculations
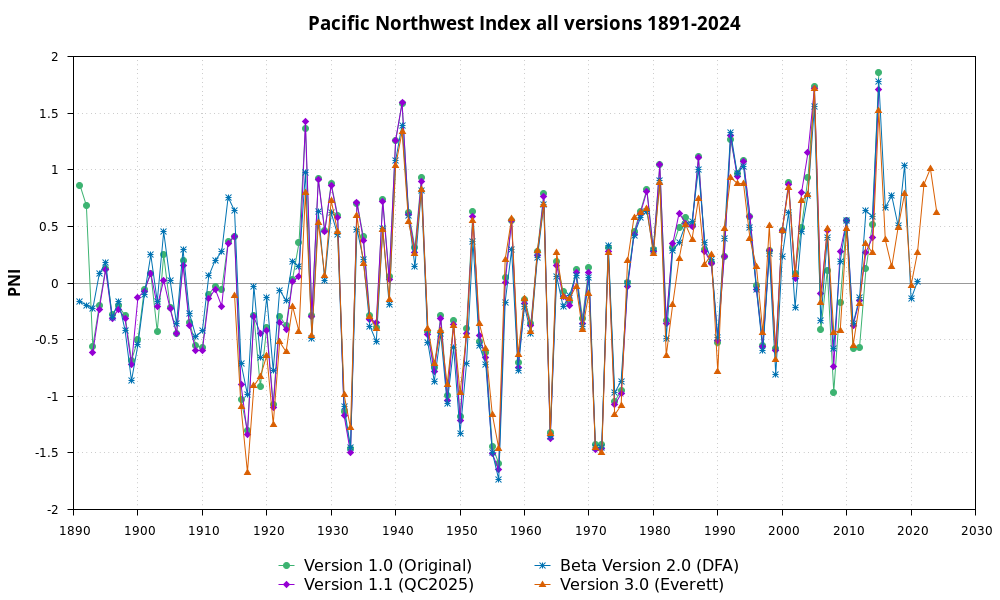
Yearly recalculations of the PNI time series using updated means and standard deviations change the historical values of the PNI, but are relatively small and likely negligible (Figures 1, 2 and 3).
The means and standard deviations for the three environmental parameters are listed for each archived record of recalculated PNI time series (Table 1 for v1.0, Table 2 for Beta v2.0, and Table 3 for v3.0).
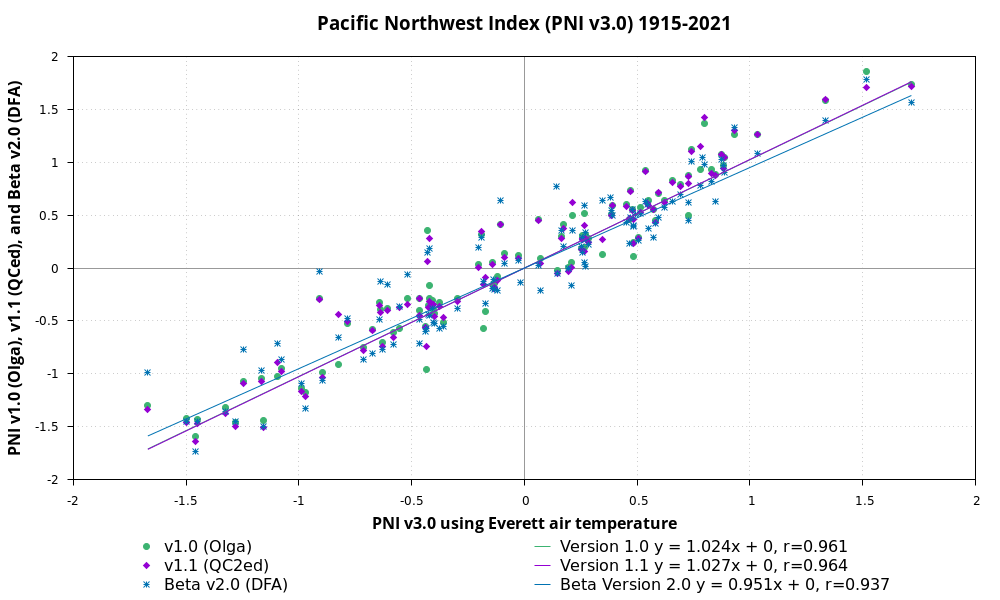
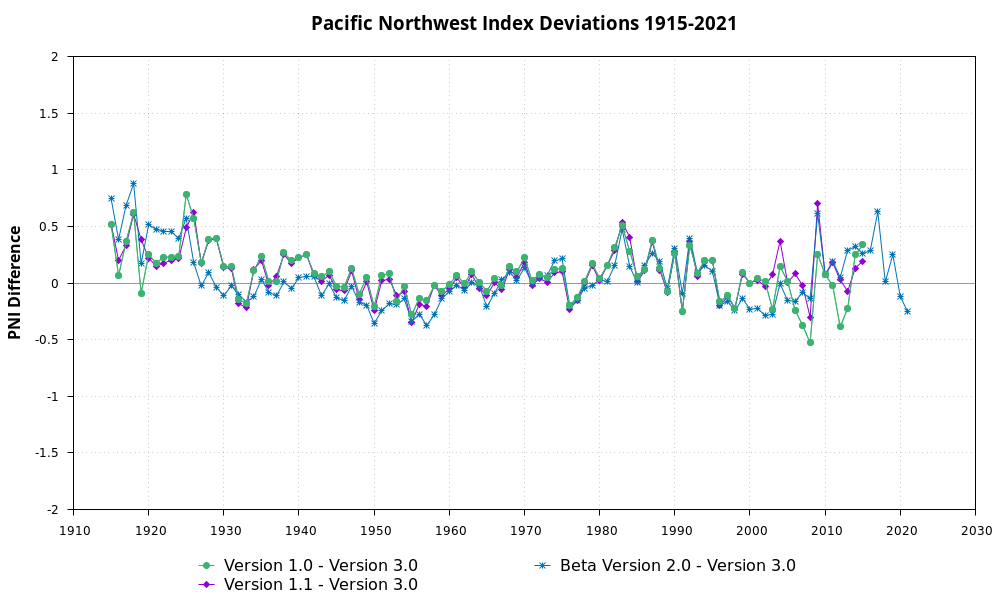
A comparison of the values of the PNI of different versions (v1.0, v1.1, Beta v2.0 and v3.0) can be viewed in Figure 4. The difference between PNI v3.0 and earlier versions of the PNI can be viewed in Figure 5 and Figure 6.
| PNI Archival Year | Data Year Range | Annual Total Precipitation at Cedar Lake | Snowpack Depth on March 15 at Paradise | Annual Mean Air temperature at Olga | |||
|---|---|---|---|---|---|---|---|
| Mean | SD | Mean | SD | Mean | SD | ||
| 1996 | 1891-1995 | 102.224 | 17.107 | 172.156 | 51.460 | 49.999 | 1.239 |
| 1997 | 1891-1996 | 102.343 | 17.057 | 171.410 | 51.547 | 49.995 | 1.234 |
| 1998 | 1891-1997 | 102.464 | 17.009 | 172.506 | 52.134 | 50.006 | 1.234 |
| 1999 | 1891-1998 | 102.488 | 16.923 | 172.425 | 51.808 | 50.018 | 1.235 |
| 2000 | 1891-1999 | 102.514 | 16.838 | 173.642 | 52.635 | 50.023 | 1.230 |
| 2001 | 1891-2000 | 102.265 | 16.937 | 173.805 | 52.330 | 50.027 | 1.225 |
| 2002 | 1891-2001 | 102.089 | 16.944 | 172.940 | 52.604 | 50.030 | 1.220 |
| 2003 | 1891-2002 | 101.943 | 16.924 | 173.548 | 52.582 | 50.036 | 1.216 |
| 2004 | 1891-2003 | 101.931 | 16.841 | 173.071 | 52.453 | 50.044 | 1.214 |
| 2005 | 1891-2004 | 101.773 | 16.837 | 173.012 | 52.146 | 50.065 | 1.228 |
| 2006 | 1891-2005 | 101.585 | 16.866 | 171.414 | 53.942 | 50.081 | 1.235 |
| 2007 | 1891-2006 | 101.734 | 16.856 | 171.750 | 53.723 | 50.084 | 1.230 |
| 2008 | 1891-2007 | 101.657 | 16.795 | 171.416 | 53.510 | 50.076 | 1.228 |
| 2009 | 1891-2008 | 101.689 | 16.720 | 171.856 | 53.372 | 50.054 | 1.245 |
| 2010 | 1891-2009 | 101.590 | 16.674 | 171.659 | 53.108 | 50.038 | 1.253 |
| 2011 | 1891-2010 | 101.606 | 16.599 | 171.326 | 52.912 | 50.051 | 1.256 |
| 2012 | 1891-2011 | 101.654 | 16.531 | 171.656 | 52.720 | 50.043 | 1.254 |
| 2013 | 1891-2012 | 101.678 | 16.458 | 172.000 | 52.542 | 50.033 | 1.254 |
| 2014 | 1891-2013 | 101.575 | 16.421 | 171.895 | 52.271 | 50.028 | 1.250 |
| 2015 | 1891-2014 | 101.748 | 16.452 | 171.677 | 52.039 | 50.054 | 1.278 |
| 2016 | 1891-2015 | 101.750 | 16.379 | 170.505 | 53.039 | 50.090 | 1.337 |
| PNI Archival Year | Data Year Range | Annual Total Precipitation at Cedar Lake | Snowpack Depth on March 15 at Paradise | Predicted Annual Mean Air Temperature at Olga | |||
|---|---|---|---|---|---|---|---|
| Mean | SD | Mean | SD | Mean | SD | ||
| NA | 1891-1995 | 102.224 | 17.107 | 172.156 | 51.460 | 49.672 | 1.273 |
| NA | 1891-1996 | 102.343 | 17.057 | 171.410 | 51.547 | 49.667 | 1.268 |
| NA | 1891-1997 | 102.464 | 17.009 | 172.506 | 52.134 | 49.678 | 1.267 |
| NA | 1891-1998 | 102.488 | 16.923 | 172.425 | 51.808 | 49.692 | 1.269 |
| NA | 1891-1999 | 102.514 | 16.838 | 173.642 | 52.635 | 49.690 | 1.264 |
| NA | 1891-2000 | 102.265 | 16.937 | 173.805 | 52.330 | 49.686 | 1.258 |
| NA | 1891-2001 | 102.089 | 16.944 | 172.940 | 52.604 | 49.681 | 1.254 |
| NA | 1891-2002 | 101.943 | 16.924 | 173.548 | 52.582 | 49.677 | 1.249 |
| NA | 1891-2003 | 101.931 | 16.841 | 173.071 | 52.453 | 49.686 | 1.247 |
| NA | 1891-2004 | 101.773 | 16.837 | 173.012 | 52.146 | 49.704 | 1.256 |
| NA | 1891-2005 | 101.585 | 16.866 | 171.414 | 53.942 | 49.716 | 1.257 |
| NA | 1891-2006 | 101.734 | 16.856 | 171.750 | 53.723 | 49.725 | 1.255 |
| NA | 1891-2007 | 101.657 | 16.795 | 171.416 | 53.510 | 49.728 | 1.250 |
| NA | 1891-2008 | 101.689 | 16.720 | 171.856 | 53.372 | 49.721 | 1.248 |
| NA | 1891-2009 | 101.590 | 16.674 | 171.659 | 53.108 | 49.717 | 1.243 |
| NA | 1891-2010 | 101.606 | 16.599 | 171.326 | 52.912 | 49.733 | 1.249 |
| NA | 1891-2011 | 101.654 | 16.531 | 171.656 | 52.720 | 49.733 | 1.244 |
| NA | 1891-2012 | 101.678 | 16.458 | 172.000 | 52.542 | 49.739 | 1.241 |
| NA | 1891-2013 | 101.575 | 16.421 | 171.895 | 52.271 | 49.752 | 1.245 |
| NA | 1891-2014 | 101.748 | 16.452 | 171.677 | 52.039 | 49.783 | 1.287 |
| NA | 1891-2015 | 101.750 | 16.379 | 170.505 | 53.039 | 49.821 | 1.348 |
| 2017 | 1891-2016 | 101.790 | 16.314 | 170.816 | 52.854 | 49.854 | 1.393 |
| 2018 | 1891-2017 | 101.703 | 16.270 | 170.576 | 52.639 | 49.868 | 1.396 |
| 2019 | 1891-2018 | 101.751 | 16.209 | 170.540 | 52.373 | 49.888 | 1.410 |
| 2020 | 1891-2019 | 101.584 | 16.244 | 170.416 | 52.126 | 49.907 | 1.420 |
| 2021 | 1891-2020 | 101.767 | 16.300 | 170.647 | 51.920 | 49.922 | 1.425 |
| 2022 | 1891-2021 | 101.744 | 16.234 | 171.049 | 51.825 | 49.929 | 1.422 |
| PNI Archival Year | Data Year Range | Annual Total Precipitation at Cedar Lake WA | Snowpack Depth on March 15 at Paradise | Annual Mean Air temperature at Everett WA | |||
|---|---|---|---|---|---|---|---|
| Mean | SD | Mean | SD | Mean | SD | ||
| NA | 1915-1995 | 101.475 | 18.391 | 171.067 | 52.103 | 50.504 | 1.245 |
| NA | 1915-1996 | 101.623 | 18.321 | 170.316 | 52.167 | 50.512 | 1.239 |
| NA | 1915-1997 | 101.773 | 18.255 | 171.455 | 52.777 | 50.538 | 1.255 |
| NA | 1915-1998 | 101.809 | 18.147 | 171.385 | 52.437 | 50.573 | 1.289 |
| NA | 1915-1999 | 101.847 | 18.041 | 172.646 | 53.291 | 50.581 | 1.283 |
| NA | 1915-2000 | 101.566 | 18.132 | 172.825 | 52.977 | 50.593 | 1.280 |
| NA | 1915-2001 | 101.370 | 18.125 | 171.951 | 53.230 | 50.602 | 1.275 |
| NA | 1915-2002 | 101.209 | 18.090 | 172.585 | 53.212 | 50.614 | 1.273 |
| NA | 1915-2003 | 101.203 | 17.987 | 172.108 | 53.065 | 50.643 | 1.295 |
| NA | 1915-2004 | 101.028 | 17.969 | 172.060 | 52.746 | 50.671 | 1.314 |
| NA | 1915-2005 | 100.820 | 17.986 | 170.435 | 54.528 | 50.698 | 1.331 |
| NA | 1915-2006 | 101.000 | 17.964 | 170.791 | 54.306 | 50.718 | 1.338 |
| NA | 1915-2007 | 100.919 | 17.886 | 170.460 | 54.077 | 50.728 | 1.335 |
| NA | 1915-2008 | 100.964 | 17.793 | 170.920 | 53.939 | 50.727 | 1.328 |
| NA | 1915-2009 | 100.857 | 17.733 | 170.730 | 53.662 | 50.695 | 1.356 |
| NA | 1915-2010 | 100.883 | 17.640 | 170.400 | 53.451 | 50.714 | 1.362 |
| NA | 1915-2011 | 100.946 | 17.556 | 170.747 | 53.257 | 50.706 | 1.357 |
| NA | 1915-2012 | 100.980 | 17.468 | 171.109 | 53.077 | 50.714 | 1.352 |
| NA | 1915-2013 | 100.870 | 17.417 | 171.011 | 52.796 | 50.721 | 1.347 |
| NA | 1915-2014 | 101.074 | 17.441 | 170.798 | 52.552 | 50.748 | 1.367 |
| NA | 1915-2015 | 101.084 | 17.354 | 169.611 | 53.537 | 50.787 | 1.415 |
| NA | 1915-2016 | 101.135 | 17.274 | 169.938 | 53.351 | 50.819 | 1.446 |
| NA | 1915-2017 | 101.249 | 17.225 | 169.701 | 53.124 | 50.831 | 1.444 |
| NA | 1915-2018 | 101.309 | 17.150 | 169.673 | 52.850 | 50.858 | 1.464 |
| NA | 1915-2019 | 101.123 | 17.179 | 169.556 | 52.592 | 50.874 | 1.466 |
| NA | 1915-2020 | 101.336 | 17.230 | 169.800 | 52.383 | 50.900 | 1.483 |
| NA | 1915-2021 | 101.207 | 17.204 | 170.218 | 52.290 | 50.913 | 1.482 |
| NA | 1915-2022 | 101.092 | 17.168 | 170.020 | 52.068 | 50.935 | 1.493 |
| NA | 1915-2023 | 100.843 | 17.293 | 169.990 | 51.813 | 50.955 | 1.500 |
| 2025 | 1915-2024 | 100.777 | 17.229 | 170.058 | 51.566 | 50.977 | 1.511 |
Reference
Ebbesmeyer, C.C. and R.M. Strickland. 1995. Oyster Condition and Climate: Evidence from Willapa Bay. Publication WSG-MR 95-02, Washington Sea Grant Program, University of Washington, Seattle, WA. 11p.
Van Holmes, C. & Gosselin J. (2020). Development of a Mean Annual Temperature Value for the Continued Calculation of the Pacific Northwest Climate Index.
Williams, J.G., S.G. Smith, J.K. Fryer, M. D. Scheuerell, W.D. Muir, T.A. Flagg, R.W. Zabel, J.W. Ferguson, and E. Casillas. 2014. Influence of ocean and freshwater conditions on Columbia River sockeye salmon Oncorhynchus nerka adult return rates. Fish. Oceanogr. 23(3):210-224. doi:10.1111/fog.12056