
Juvenile Production Estimates (JPE) for Sacramento River Winter-run Chinook Salmon
Data extracted by SacPAS from "Juvenile Production Estimates (JPE) for Sacramento River Winter-run Chinook Salmon by Brood Year" letters from National Marine Fisheries Service, National Oceanic and Atmospheric Administration, U.S. Department of Commerce to the Bureau of Reclamation, U.S. Department of the Interior (hereafter termed "JPE letter"), available from California Central Valley Water Operations: Biological Opinion Actions, NOAA Fisheries. Juvenile Production Estimates (JPE) Methods through the years.
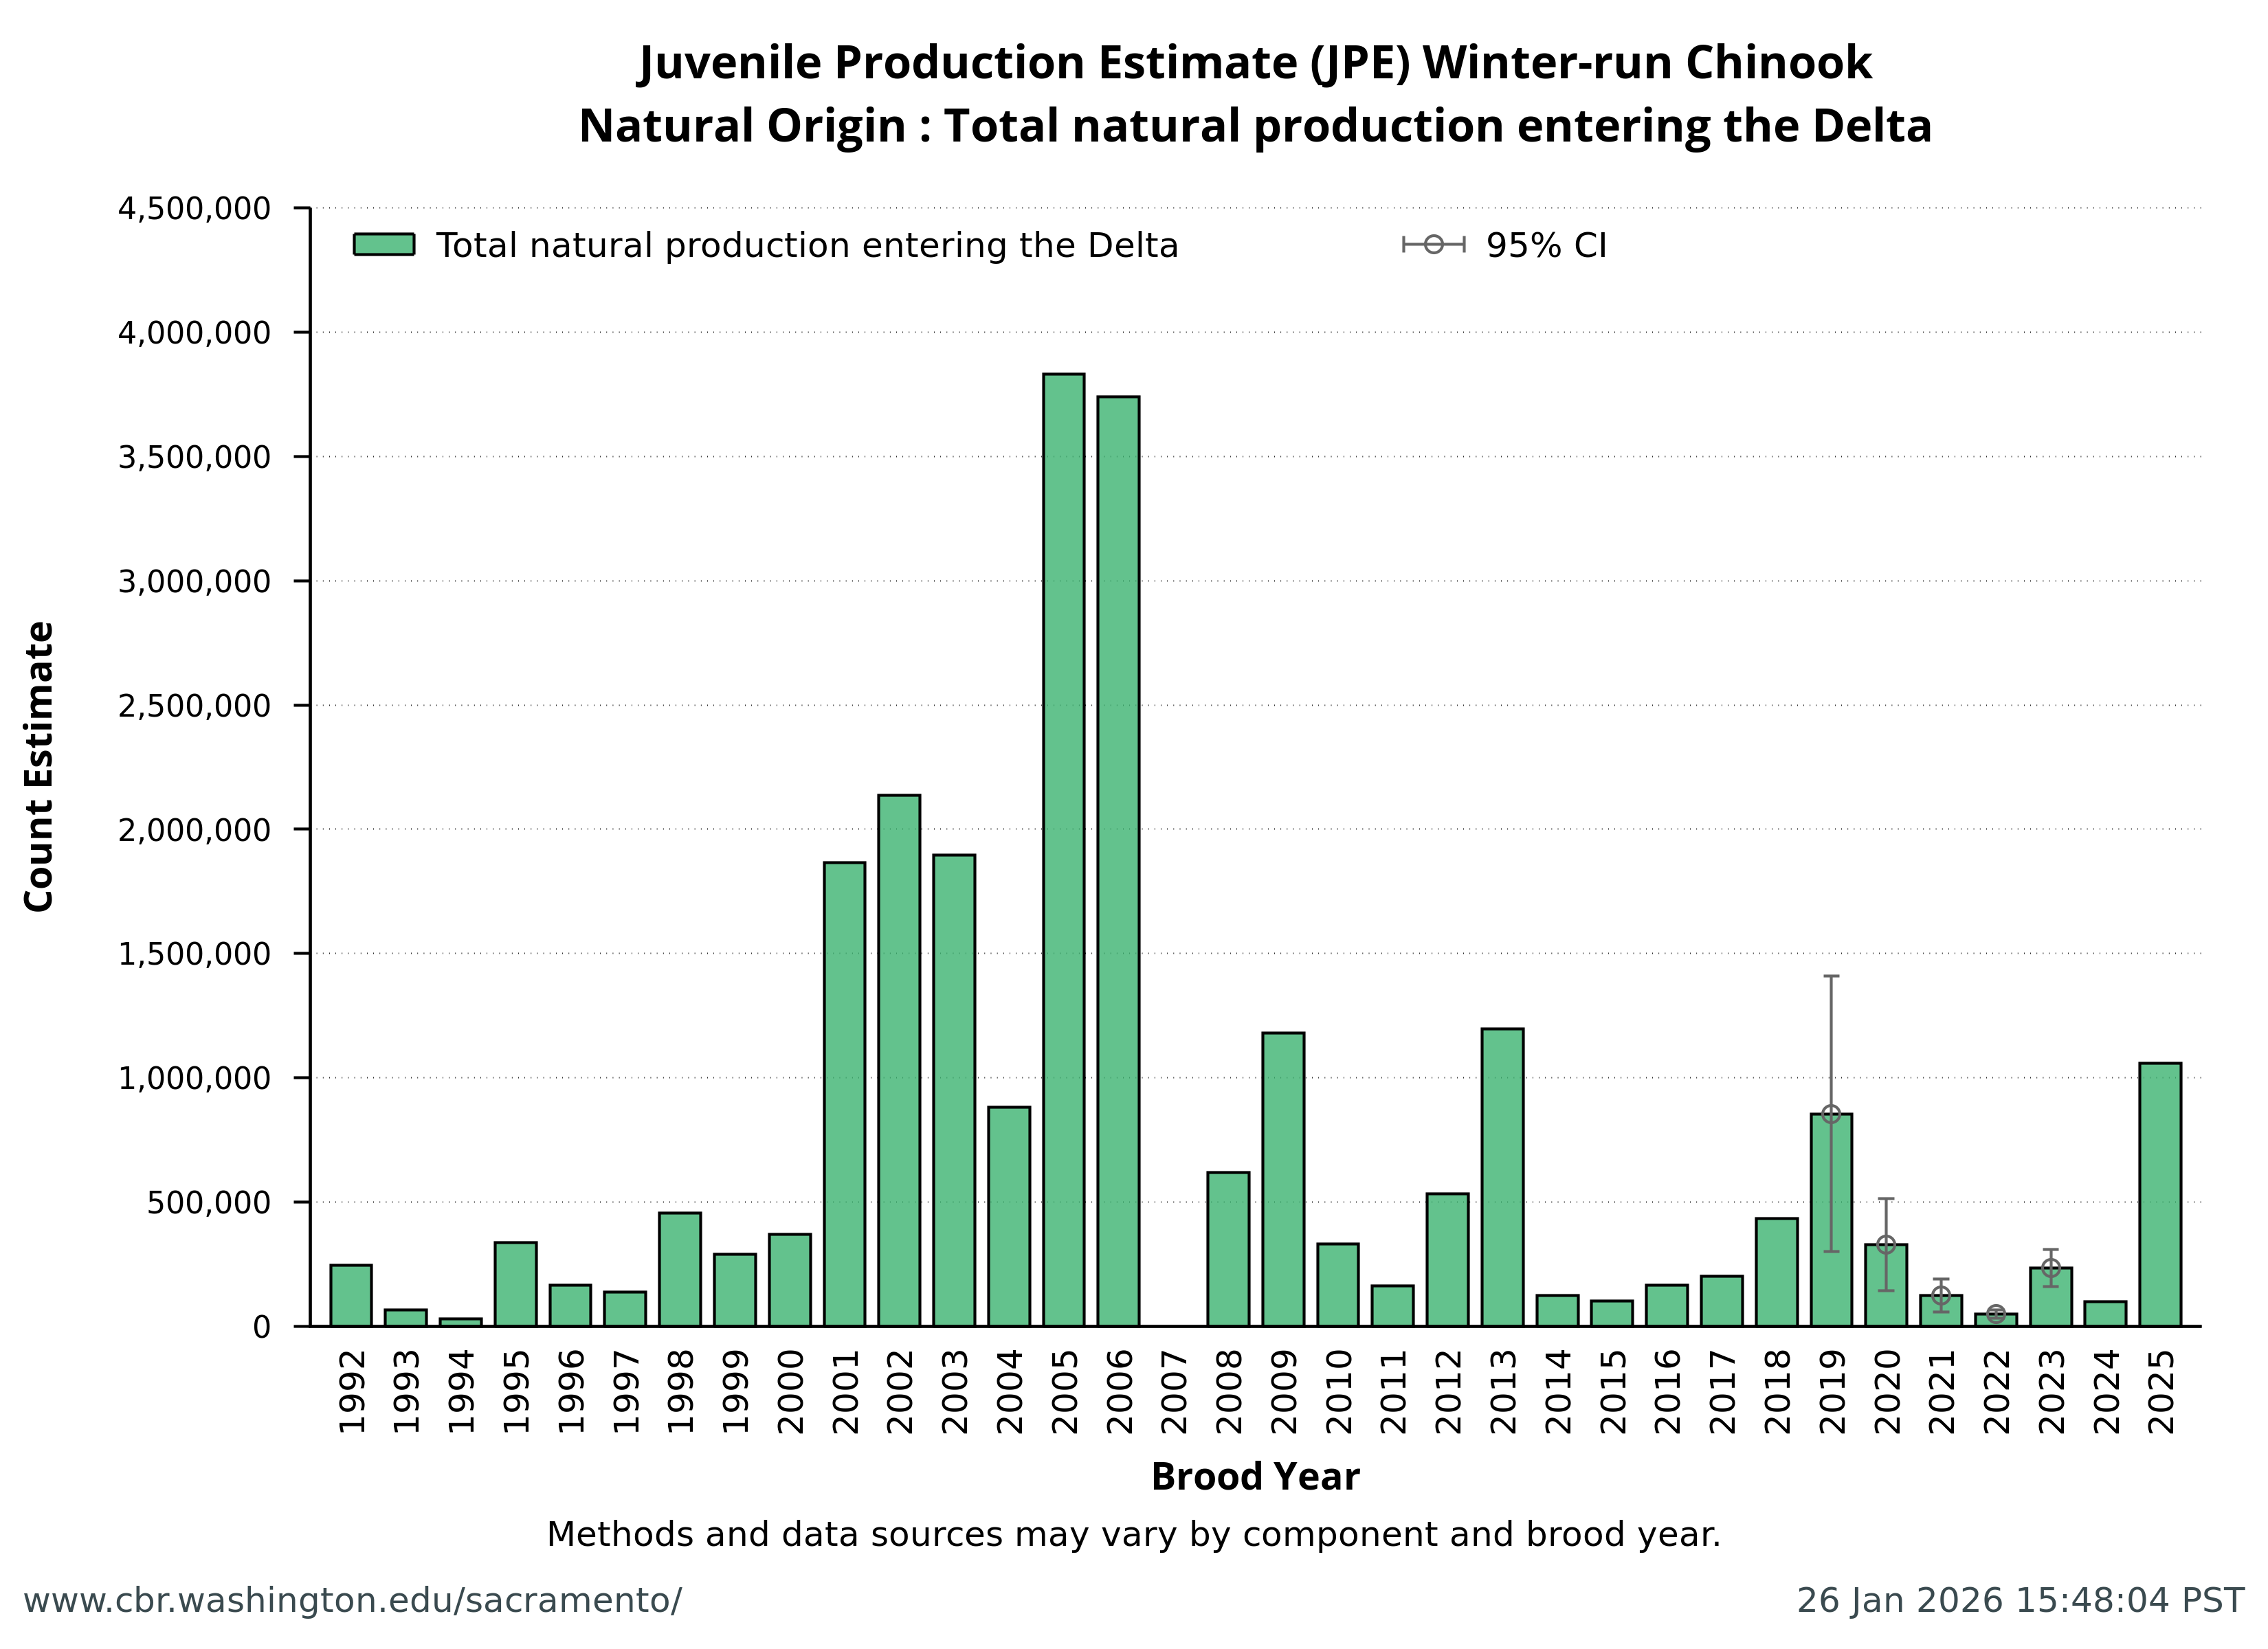
Natural Origin: Total natural production entering the Delta

| Brood Year | Value | Component | Origin | JPE letter date | Footnote | References & Contributors | Lower 95% CI | Upper 95% CI |
|---|---|---|---|---|---|---|---|---|
| 1992 | 246,157 | Total natural production entering the Delta | Natural | 1993-02-09 | NA | NA | NA | NA |
| 1993 | 66,536 | Total natural production entering the Delta | Natural | 1993-10-01 | NA | NA | NA | NA |
| 1994 | 31,491 | Total natural production entering the Delta | Natural | 1995-02-21 | NA | NA | NA | NA |
| 1995 | 338,107 | Total natural production entering the Delta | Natural | 1995-10-20 | NA | NA | NA | NA |
| 1996 | 165,069 | Total natural production entering the Delta | Natural | 1997-02-10 | NA | NA | NA | NA |
| 1997 | 138,316 | Total natural production entering the Delta | Natural | 1998-04-27 | NA | NA | NA | NA |
| 1998 | 454,792 | Total natural production entering the Delta | Natural | 1999-02-26 | NA | NA | NA | NA |
| 1999 | 289,724 | Total natural production entering the Delta | Natural | 2000-01-01 | NA | NA | NA | NA |
| 2000 | 370,221 | Total natural production entering the Delta | Natural | 2001-01-29 | NA | NA | NA | NA |
| 2001 | 1,864,802 | Total natural production entering the Delta | Natural | 2002-02-22 | NA | NA | NA | NA |
| 2002 | 2,136,747 | Total natural production entering the Delta | Natural | 2003-02-19 | NA | NA | NA | NA |
| 2003 | 1,896,649 | Total natural production entering the Delta | Natural | 2004-01-21 | NA | NA | NA | NA |
| 2004 | 881,719 | Total natural production entering the Delta | Natural | 2005-02-08 | NA | NA | NA | NA |
| 2005 | 3,831,286 | Total natural production entering the Delta | Natural | 2006-02-10 | NA | NA | NA | NA |
| 2006 | 3,739,069 | Total natural production entering the Delta | Natural | 2007-02-15 | NA | NA | NA | NA |
| 2007 | NA | Total natural production entering the Delta | Natural | NA | NA | NA | NA | NA |
| 2008 | 617,783 | Total natural production entering the Delta | Natural | 2009-01-12 | NA | NA | NA | NA |
| 2009 | 1,179,633 | Total natural production entering the Delta | Natural | 2010-02-24 | NA | NA | NA | NA |
| 2010 | 332,012 | Total natural production entering the Delta | Natural | 2011-01-12 | NA | NA | NA | NA |
| 2011 | 162,051 | Total natural production entering the Delta | Natural | 2012-01-26 | NA | NA | NA | NA |
| 2012 | 532,809 | Total natural production entering the Delta | Natural | 2013-01-31 | NA | NA | NA | NA |
| 2013 | 1,196,387 | Total natural production entering the Delta | Natural | 2014-02-21 | NA | NA | NA | NA |
| 2014 | 124,521 | Total natural production entering the Delta | Natural | 2015-01-16 | NA | NA | NA | NA |
| 2015 | 101,716 | Total natural production entering the Delta | Natural | 2016-01-28 | NA | NA | NA | NA |
| 2016 | 166,189 | Total natural production entering the Delta | Natural | 2017-02-03 | NA | NA | NA | NA |
| 2017 | 201,409 | Total natural production entering the Delta | Natural | 2018-01-08 | NA | NA | NA | NA |
| 2018 | 433,176 | Total natural production entering the Delta | Natural | 2019-02-01 | NA | NA | NA | NA |
| 2019 | 854,941 | Total natural production entering the Delta | Natural | 2020-01-23 | NA | Method 2 (O’Farrell et al 2018) with data from USFWS, UC Santa Cruz, and SWFSC | 301,002 | 1,408,880 |
| 2020 | 330,130 | Total natural production entering the Delta | Natural | 2021-01-15 | NA | Method 2 (O’Farrell et al 2018) with data from USFWS, UC Santa Cruz, and SWFSC | 145,088 | 515,172 |
| 2021 | 125,038 | Total natural production entering the Delta | Natural | 2022-01-14 | NA | Method 2 (O’Farrell et al 2018) with data from USFWS, UC Santa Cruz, and SWFSC | 59,064 | 191,013 |
| 2022 | 49,924 | Total natural production entering the Delta | Natural | 2023-01-13 | NA | Method 2 (O’Farrell et al 2018) with data from USFWS, UC Santa Cruz, and SWFSC | 32,298 | 67,550 |
| 2023 | 234,896 | Total natural production entering the Delta | Natural | 2024-01-12 | NA | Method 2 (O'Farrell et al 2018) with data from USFWS, UC Santa Cruz, and SWFSC | 159,951 | 309,841 |
| 2024 | 98,893 | Total natural production entering the Delta | Natural | 2025-01-10 | NA | Method 2 (O'Farrell et al 2018) with data from USFWS, UC Santa Cruz, and SWFSC | NA | NA |
| 2025 | 1,057,452 | Total natural production entering the Delta | Natural | 2026-01-08 | NA | Method 2 (O'Farrell et al 2018) with data from USFWS, UC Santa Cruz, and SWFSC | NA | NA |
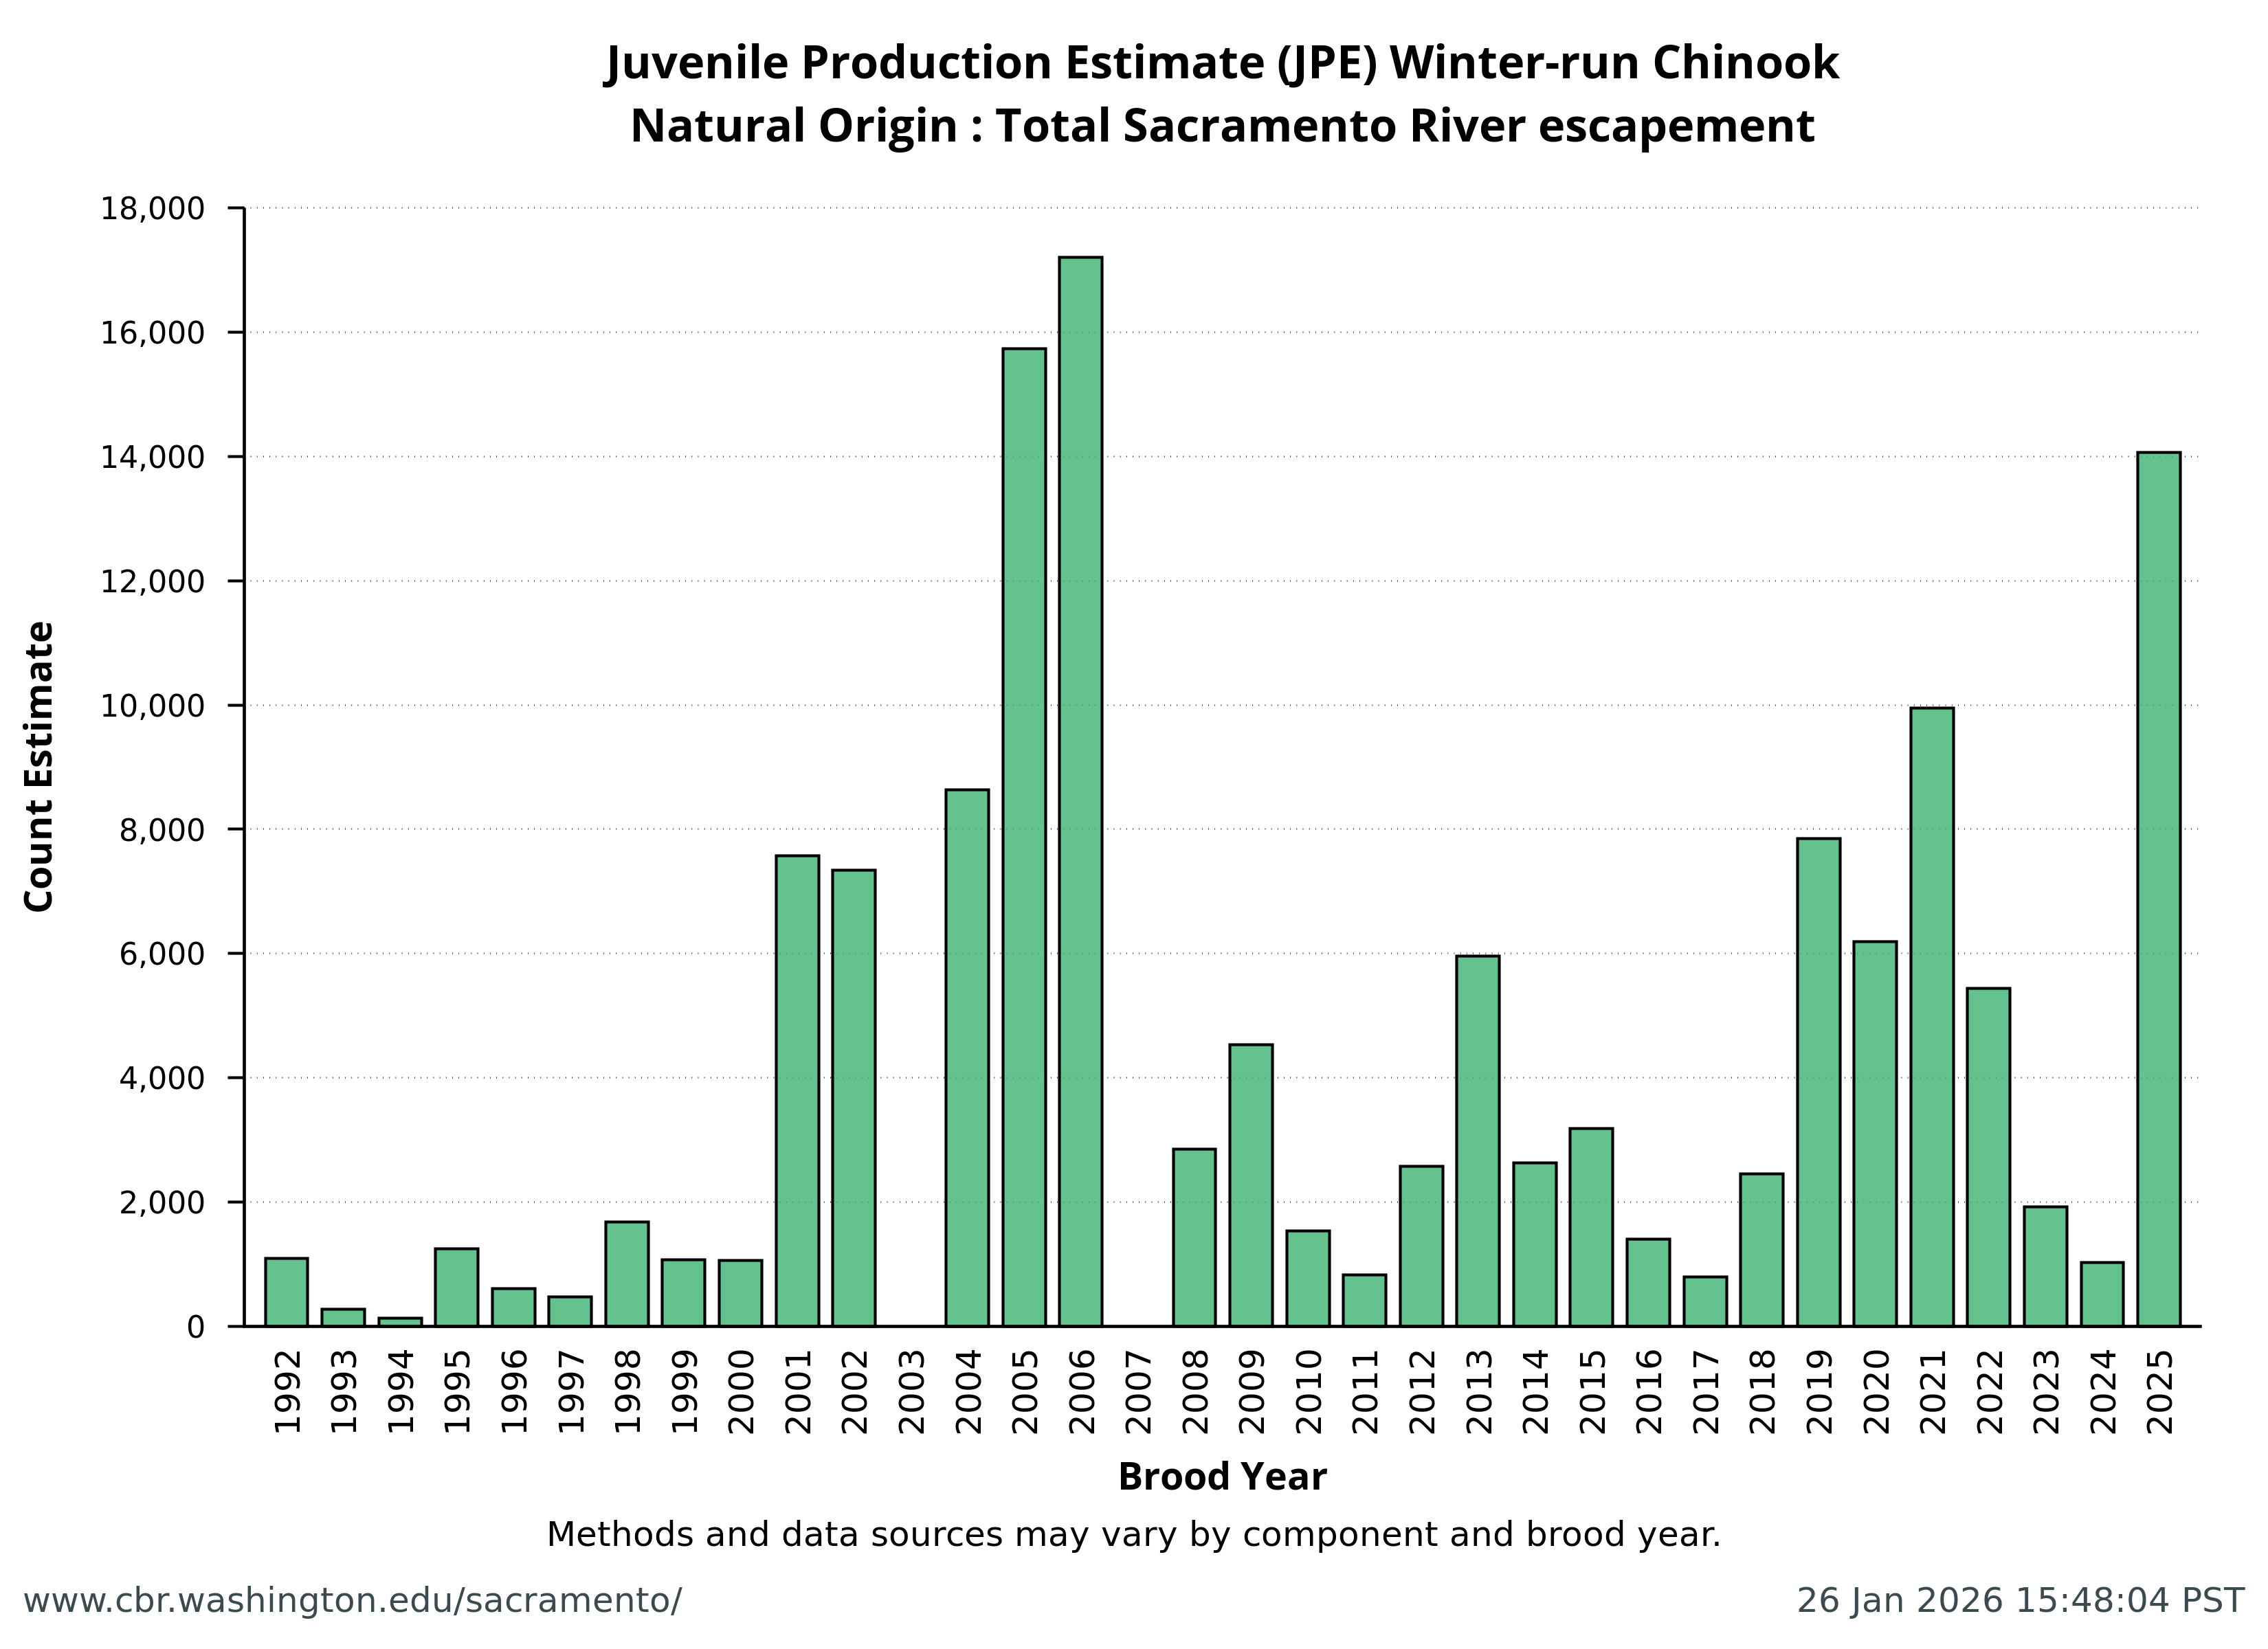
Natural Origin: Total Sacramento River escapement

| Brood Year | Value | Component | Origin | JPE letter date | Footnote* | References & Contributors | Lower 95% CI | Upper 95% CI |
|---|---|---|---|---|---|---|---|---|
| 1992 | 1,092 | Total Sacramento River escapement | Natural | 1993-02-09 | NA | CDFW, USFWS | NA | NA |
| 1993 | 271 | Total Sacramento River escapement | Natural | 1993-10-01 | NA | CDFW, USFWS | NA | NA |
| 1994 | 129 | Total Sacramento River escapement | Natural | 1995-02-21 | NA | CDFW, USFWS | NA | NA |
| 1995 | 1,251 | Total Sacramento River escapement | Natural | 1995-10-20 | NA | CDFW, USFWS | NA | NA |
| 1996 | 611 | Total Sacramento River escapement | Natural | 1997-02-10 | NA | CDFW, USFWS | NA | NA |
| 1997 | 480 | Total Sacramento River escapement | Natural | 1998-04-27 | NA | CDFW, USFWS | NA | NA |
| 1998 | 1,682 | Total Sacramento River escapement | Natural | 1999-02-26 | NA | CDFW, USFWS | NA | NA |
| 1999 | 1,072 | Total Sacramento River escapement | Natural | 2000-01-01 | NA | CDFW, USFWS | NA | NA |
| 2000 | 1,059 | Total Sacramento River escapement | Natural | 2001-01-29 | NA | CDFW, USFWS | NA | NA |
| 2001 | 7,572 | Total Sacramento River escapement | Natural | 2002-02-22 | "1/ Based on DFG carcass survey (Jolly-Seber model), includes hatchery and grilse" | CDFW, USFWS | NA | NA |
| 2002 | 7,337 | Total Sacramento River escapement | Natural | 2003-02-19 | "1/ 2002 CDFG Carcass Survey (Jolly-Seber) Estimate from 1/24/03, includes hatchery returns and grilse." | CDFW, USFWS | NA | NA |
| 2003 | NA | Total Sacramento River escapement | Natural | NA | NA | NA | NA | NA |
| 2004 | 8,635 | Total Sacramento River escapement | Natural | 2005-02-08 | NA | CDFW, USFWS | NA | NA |
| 2005 | 15,730 | Total Sacramento River escapement | Natural | 2006-02-10 | "1/ 2005 carcass survey estimate (Jolly-Seber) from DFG letter, 1/13/06, includes both wild and hatchery origin." | CDFW, USFWS | NA | NA |
| 2006 | 17,205 | Total Sacramento River escapement | Natural | 2007-02-15 | "1/ 2006 carcass survey (DFG letter dated 12/7/06), Jolly-Seber est. includes both wild and hatchery origin." | CDFW, USFWS | NA | NA |
| 2007 | NA | Total Sacramento River escapement | Natural | NA | NA | NA | NA | NA |
| 2008 | 2,850 | Total Sacramento River escapement | Natural | 2009-01-12 | "1/ Based on DFG official estimate, letter to NMFS received 11/25/08, includes hatchery broodstock." | CDFW, USFWS | NA | NA |
| 2009 | 4,537 | Total Sacramento River escapement | Natural | 2010-02-24 | "1/ Based on DFG letter dated 1/14/10, includes hatchery broodstock." | CDFW, USFWS | NA | NA |
| 2010 | 1,533 | Total Sacramento River escapement | Natural | 2011-01-12 | "1/ Based on DFG letter to Rod McInnis 12/08/10, in-river spawners minus hatchery broodstock." | CDFW, USFWS | NA | NA |
| 2011 | 824 | Total Sacramento River escapement | Natural | 2012-01-26 | "1/ total in-river escapement using Jolly-Seber model, includes fish taken for hatchery broodstock (738 +86 =824) from DFG letter 12/6/11." | CDFW, USFWS | NA | NA |
| 2012 | 2,581 | Total Sacramento River escapement | Natural | 2013-01-31 | "1/ Total in-river escapement (90% CI) using modified Cormack Jolly-Seber (CJS) model, includes 803 hatchery fish from CDFW letter 1/4/13, but does not include 93 removed for LSNFH." | CDFW, USFWS | NA | NA |
| 2013 | 5,958 | Total Sacramento River escapement | Natural | 2014-02-21 | "1/ Total in-river escapement from Cormack-Jolly-Seber (CJS) model (90% CI), includes natural and hatchery origin, but not 117 collected at Keswick trap for LSNFH (CDFW letter 1/7/14)." | CDFW, USFWS | NA | NA |
| 2014 | 2,627 | Total Sacramento River escapement | Natural | 2015-01-16 | "1/ Total in-river escapement from Cormack-Jolly Seber (CIS) model includes natural and hatchery origin" | CDFW, USFWS | NA | NA |
| 2015 | 3,182 | Total Sacramento River escapement | Natural | 2016-01-28 | "1/ Total in-river escapement from Cormack-Jolly Seber (CJS) model includes natural and hatchery origin, but not hatchery fish retained for brood stock at Livingston Stone National Fish Hatchery." | CDFW, USFWS | NA | NA |
| 2016 | 1,409 | Total Sacramento River escapement | Natural | 2017-02-03 | "1/ Total in-river escapement from CDFW Cormack-Jolly Seber (CJS) model includes natural and hatchery origin, but not hatchery fish retained for brood stock at LSNFH." | CDFW, USFWS | NA | NA |
| 2017 | 795 | Total Sacramento River escapement | Natural | 2018-01-08 | "1/ Total in-river escapement from CDFW Cormack-Jolly Seber (CJS) model includes natural and hatchery origin, but not hatchery fish retained for brood stock at LSNFH." | CDFW, USFWS | NA | NA |
| 2018 | 2,458 | Total Sacramento River escapement | Natural | 2019-02-01 | "1/ Total in-river escapement from CDFW Cormack-Jolly Seber (CJS) model includes natural and hatchery origin, but not hatchery fish retained for brood stock at LSNFH." | CDFW, USFWS | NA | NA |
| 2019 | 7,852 | Total Sacramento River escapement | Natural | 2020-01-23 | "1/ Total in-river escapement from CDFW Cormack-Jolly Seber (CJS) model includes natural and hatchery origin, but not hatchery fish retained for brood stock at LSNFH." | CDFW, USFWS | NA | NA |
| 2020 | 6,195 | Total Sacramento River escapement | Natural | 2021-01-15 | "1/ Total Sacramento River in-river escapement from CDFW Cormack-Jolly Seber (CJS) model includes natural and hatchery origin, but not hatchery fish retained for brood stock at LSNFH." | CDFW, USFWS | NA | NA |
| 2021 | 9,956 | Total Sacramento River escapement | Natural | 2022-01-14 | "1/ Total Sacramento River in-river escapement from CDFW Cormack-Jolly Seber (CJS) model includes natural- and hatchery-origin winter-run Chinook Salmon, but not hatchery fish retained for brood stock at LSNFH." | CDFW, USFWS | NA | NA |
| 2022 | 5,443 | Total Sacramento River escapement | Natural | 2023-01-13 | "1/ Total Sacramento River in-river escapement from CDFW Cormack-Jolly Seber (CJS) model includes natural- and hatchery-origin winter-run Chinook Salmon, but not hatchery fish retained for brood stock at LSNFH." | CDFW, USFWS | NA | NA |
| 2023 | 1,920 | Total Sacramento River escapement | Natural | 2024-01-12 | "1/ Total Sacramento River in-river escapement from CDFW Cormack-Jolly Seber (CJS) model includes natural- and hatchery-origin winter-run Chinook Salmon, but not hatchery fish retained for brood stock at LSNFH." | CDFW, USFWS | NA | NA |
| 2024 | 1,024 | Total Sacramento River escapement | Natural | 2025-01-10 | "1/ Total Sacramento River in-river escapement from CDFW Cormack-Jolly Seber (CJS) model includes natural- and hatchery-origin winter-run Chinook Salmon, but not hatchery fish retained for brood stock at LSNFH." | CDFW, USFWS | NA | NA |
| 2025 | 14,062 | Total Sacramento River escapement | Natural | 2026-01-08 | "1/ Total Sacramento River in-river escapement from CDFW Cormack-Jolly Seber (CJS) model includes natural- and hatchery-origin winter-run Chinook Salmon, but not hatchery fish retained for brood stock at LSNFH." | CDFW, USFWS | NA | NA |
| *From Table 1 of "Final Winter-Run Juvenile Production Estimate Recommendation for Brood Year" letters from CDFW / Winter-run PWT to NMFS (Enclosures in JPE letters) | ||||||||
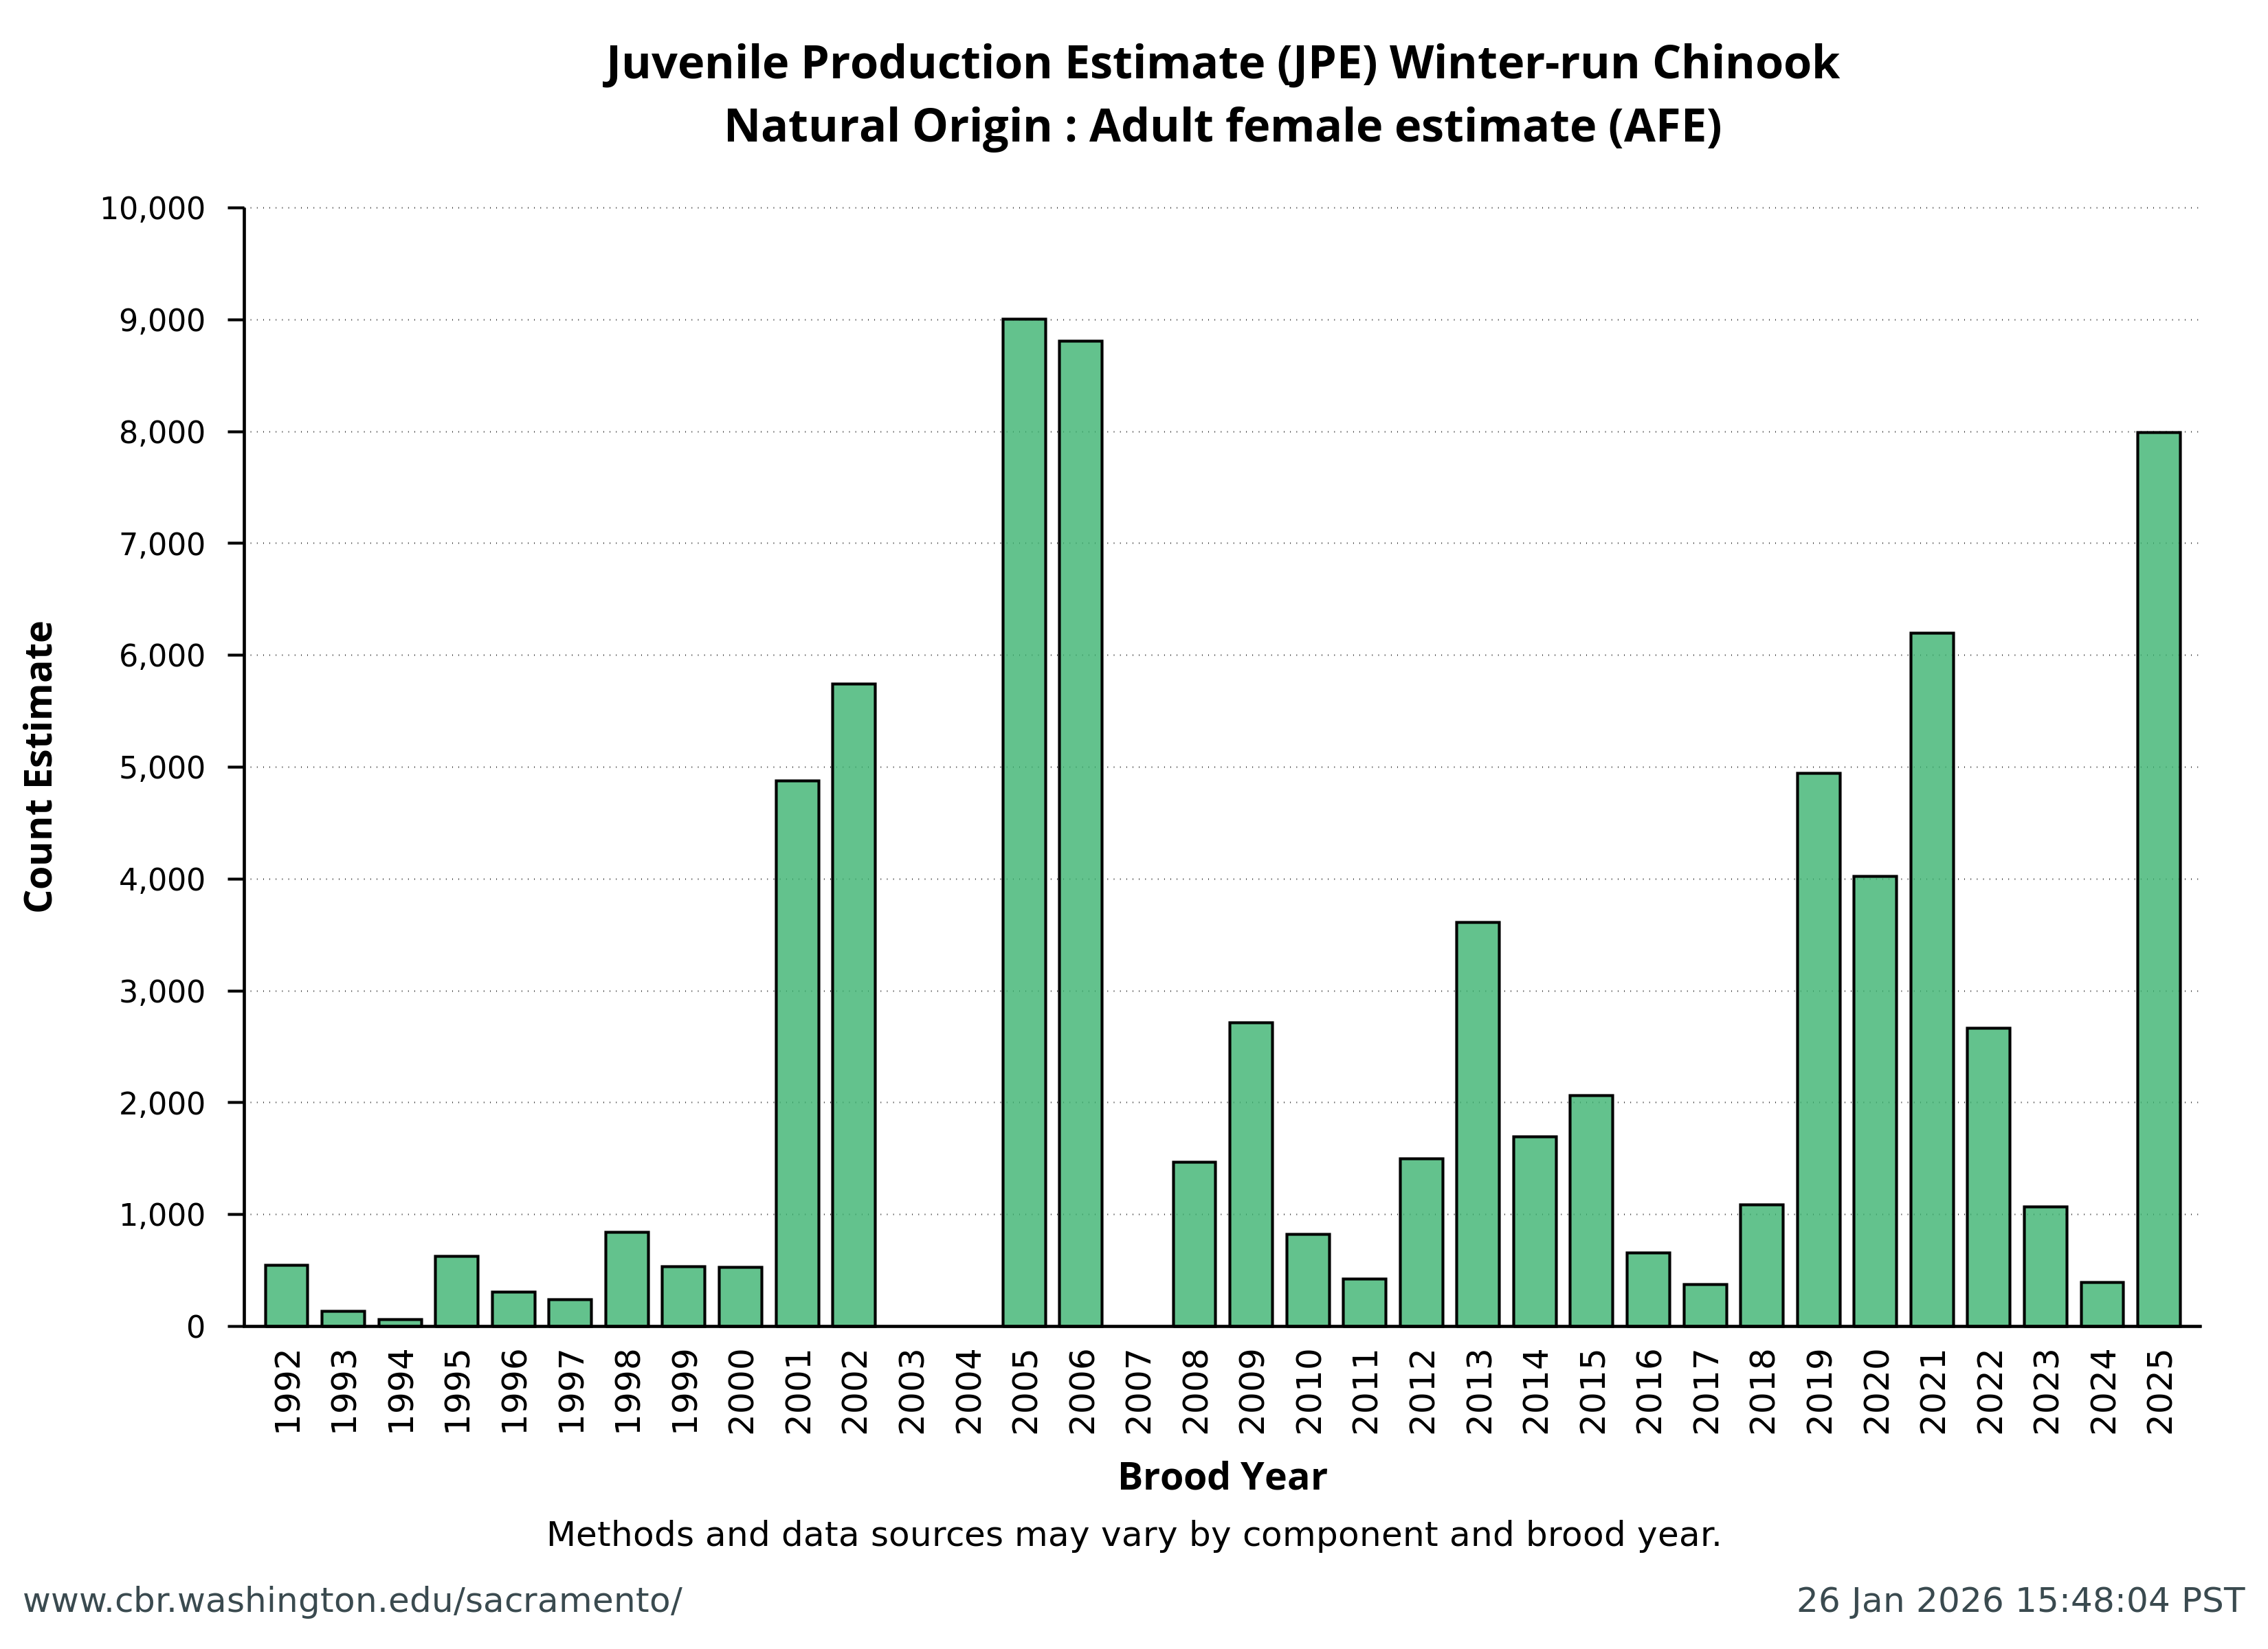
Natural Origin: Adult female estimate (AFE)

| Brood Year | Value | Component | Origin | JPE letter date | Footnote* | References & Contributors | Lower 95% CI | Upper 95% CI |
|---|---|---|---|---|---|---|---|---|
| 1992 | 546 | Adult female estimate (AFE) | Natural | 1993-02-09 | NA | CDFW, USFWS | NA | NA |
| 1993 | 135 | Adult female estimate (AFE) | Natural | 1993-10-01 | NA | CDFW, USFWS | NA | NA |
| 1994 | 64 | Adult female estimate (AFE) | Natural | 1995-02-21 | NA | CDFW, USFWS | NA | NA |
| 1995 | 625 | Adult female estimate (AFE) | Natural | 1995-10-20 | NA | CDFW, USFWS | NA | NA |
| 1996 | 305 | Adult female estimate (AFE) | Natural | 1997-02-10 | NA | CDFW, USFWS | NA | NA |
| 1997 | 240 | Adult female estimate (AFE) | Natural | 1998-04-27 | NA | CDFW, USFWS | NA | NA |
| 1998 | 841 | Adult female estimate (AFE) | Natural | 1999-02-26 | NA | CDFW, USFWS | NA | NA |
| 1999 | 536 | Adult female estimate (AFE) | Natural | 2000-01-01 | NA | CDFW, USFWS | NA | NA |
| 2000 | 529 | Adult female estimate (AFE) | Natural | 2001-01-29 | NA | CDFW, USFWS | NA | NA |
| 2001 | 4,876 | Adult female estimate (AFE) | Natural | 2002-02-22 | "2/ Based on observed grilse and sex ratio, DFG carcass survey 2001" | CDFW, USFWS | NA | NA |
| 2002 | 5,745 | Adult female estimate (AFE) | Natural | 2003-02-19 | "2/ 2002 CDFG Carcass Survey observed proportion of adult females." | CDFW, USFWS | NA | NA |
| 2003 | NA | Adult female estimate (AFE) | Natural | NA | NA | NA | NA | NA |
| 2004 | NA | Adult female estimate (AFE) | Natural | NA | NA | NA | NA | NA |
| 2005 | 9,005 | Adult female estimate (AFE) | Natural | 2006-02-10 | "2/ Number of females estimated from the carcass surveys (hatchery + natural origin)" | CDFW, USFWS | NA | NA |
| 2006 | 8,811 | Adult female estimate (AFE) | Natural | 2007-02-15 | "2/ Number of females estimated from the carcass surveys (hatchery + natural origin)" | CDFW, USFWS | NA | NA |
| 2007 | NA | Adult female estimate (AFE) | Natural | NA | NA | NA | NA | NA |
| 2008 | 1,466 | Adult female estimate (AFE) | Natural | 2009-01-12 | "2/ Used sex ratio from Keswick trap( 53%) instead of carcass surveys(78%) to account for bias in males" | CDFW, USFWS | NA | NA |
| 2009 | 2,717 | Adult female estimate (AFE) | Natural | 2010-02-24 | "2/ Sex ratio was based on data collected in 2009 carcass survey (USFWS pre-release report 1/25/10)" | CDFW, USFWS | NA | NA |
| 2010 | 822 | Adult female estimate (AFE) | Natural | 2011-01-12 | "2/ Sex ratio from carcass survey, number of females estimated from DFG letter" | CDFW, USFWS | NA | NA |
| 2011 | 424 | Adult female estimate (AFE) | Natural | 2012-01-26 | "2/ Sex ratio from 2011 Keswick trap instead of carcass surveys to account for bias in males. Number of females estimated is from DFG letter 12/6/11." | CDFW, USFWS | NA | NA |
| 2012 | 1,498 | Adult female estimate (AFE) | Natural | 2013-01-31 | "2/ The number of females is derived from carcass surveys by applying the CJS model and then the number of males is derived using the sex ratio at the Keswick trapping station." | CDFW, USFWS | NA | NA |
| 2013 | 3,613 | Adult female estimate (AFE) | Natural | 2014-02-21 | "2/ The number of females is derived from carcass survey and then the number of males is derived using sex ratio at Keswick trap." | CDFW, USFWS | NA | NA |
| 2014 | 1,698 | Adult female estimate (AFE) | Natural | 2015-01-16 | "2/ The number of adult (age 3 or older) females is derived from carcass survey and then the number of males is derived using sex ratio at Keswick trap" | CDFW, USFWS | NA | NA |
| 2015 | 2,063 | Adult female estimate (AFE) | Natural | 2016-01-28 | "2/ The number of adult (age 3 or older) females is derived from carcass survey and then the number of males is derived using sex ratio at Keswick trap" | CDFW, USFWS | NA | NA |
| 2016 | 658 | Adult female estimate (AFE) | Natural | 2017-02-03 | "2/ The number of adult females is derived from carcass survey and then the number of males is derived using sex ratio at Keswick trap" | CDFW, USFWS | NA | NA |
| 2017 | 373 | Adult female estimate (AFE) | Natural | 2018-01-08 | "2/ The number of adult females is derived from carcass survey and then the number of males is derived using sex ratio at Keswick trap" | CDFW, USFWS | NA | NA |
| 2018 | 1,088 | Adult female estimate (AFE) | Natural | 2019-02-01 | "2/ The number of adult females is derived from carcass surveys, and the number of males is derived using sex ratio at Keswick trap." | CDFW, USFWS | NA | NA |
| 2019 | 4,947 | Adult female estimate (AFE) | Natural | 2020-01-23 | "2/ The number of adult females is derived from carcass surveys, and the number of males is derived using sex ratio at Keswick trap." | CDFW, USFWS | NA | NA |
| 2020 | 4,023 | Adult female estimate (AFE) | Natural | 2021-01-15 | "2/ The number of adult females is derived from carcass surveys on the Sacramento River. Naturally spawning winter-run in Battle Creek are not included." | CDFW, USFWS | NA | NA |
| 2021 | 6,199 | Adult female estimate (AFE) | Natural | 2022-01-14 | "2/ The number of adult females is derived from carcass surveys on the Sacramento River. Naturally spawning winter-run Chinook Salmon in Battle Creek are not included." | CDFW, USFWS | NA | NA |
| 2022 | 2,663 | Adult female estimate (AFE) | Natural | 2023-01-13 | "2/ The number of adult females is derived from carcass surveys on the Sacramento River. Naturally spawning winter-run Chinook Salmon in Battle Creek are not included." | CDFW, USFWS | NA | NA |
| 2023 | 1,070 | Adult female estimate (AFE) | Natural | 2024-01-12 | "2/ The number of adult females is derived from carcass surveys on the Sacramento River. Naturally spawning winter-run Chinook Salmon in Battle Creek are not included." | CDFW, USFWS | NA | NA |
| 2024 | 392 | Adult female estimate (AFE) | Natural | 2025-01-10 | "2/ The number of adult females is derived from carcass surveys on the Sacramento River. Naturally spawning winter-run Chinook Salmon in Battle Creek are not included." | CDFW, USFWS | NA | NA |
| 2025 | 7,992 | Adult female estimate (AFE) | Natural | 2026-01-08 | "2/ The number of adult females is derived from carcass surveys on the Sacramento River. Naturally spawning winter-run Chinook Salmon in Battle Creek are not included" | CDFW, USFWS | NA | NA |
| *From Table 1 of "Final Winter-Run Juvenile Production Estimate Recommendation for Brood Year" letters from CDFW / Winter-run PWT to NMFS (Enclosures in JPE letters) | ||||||||
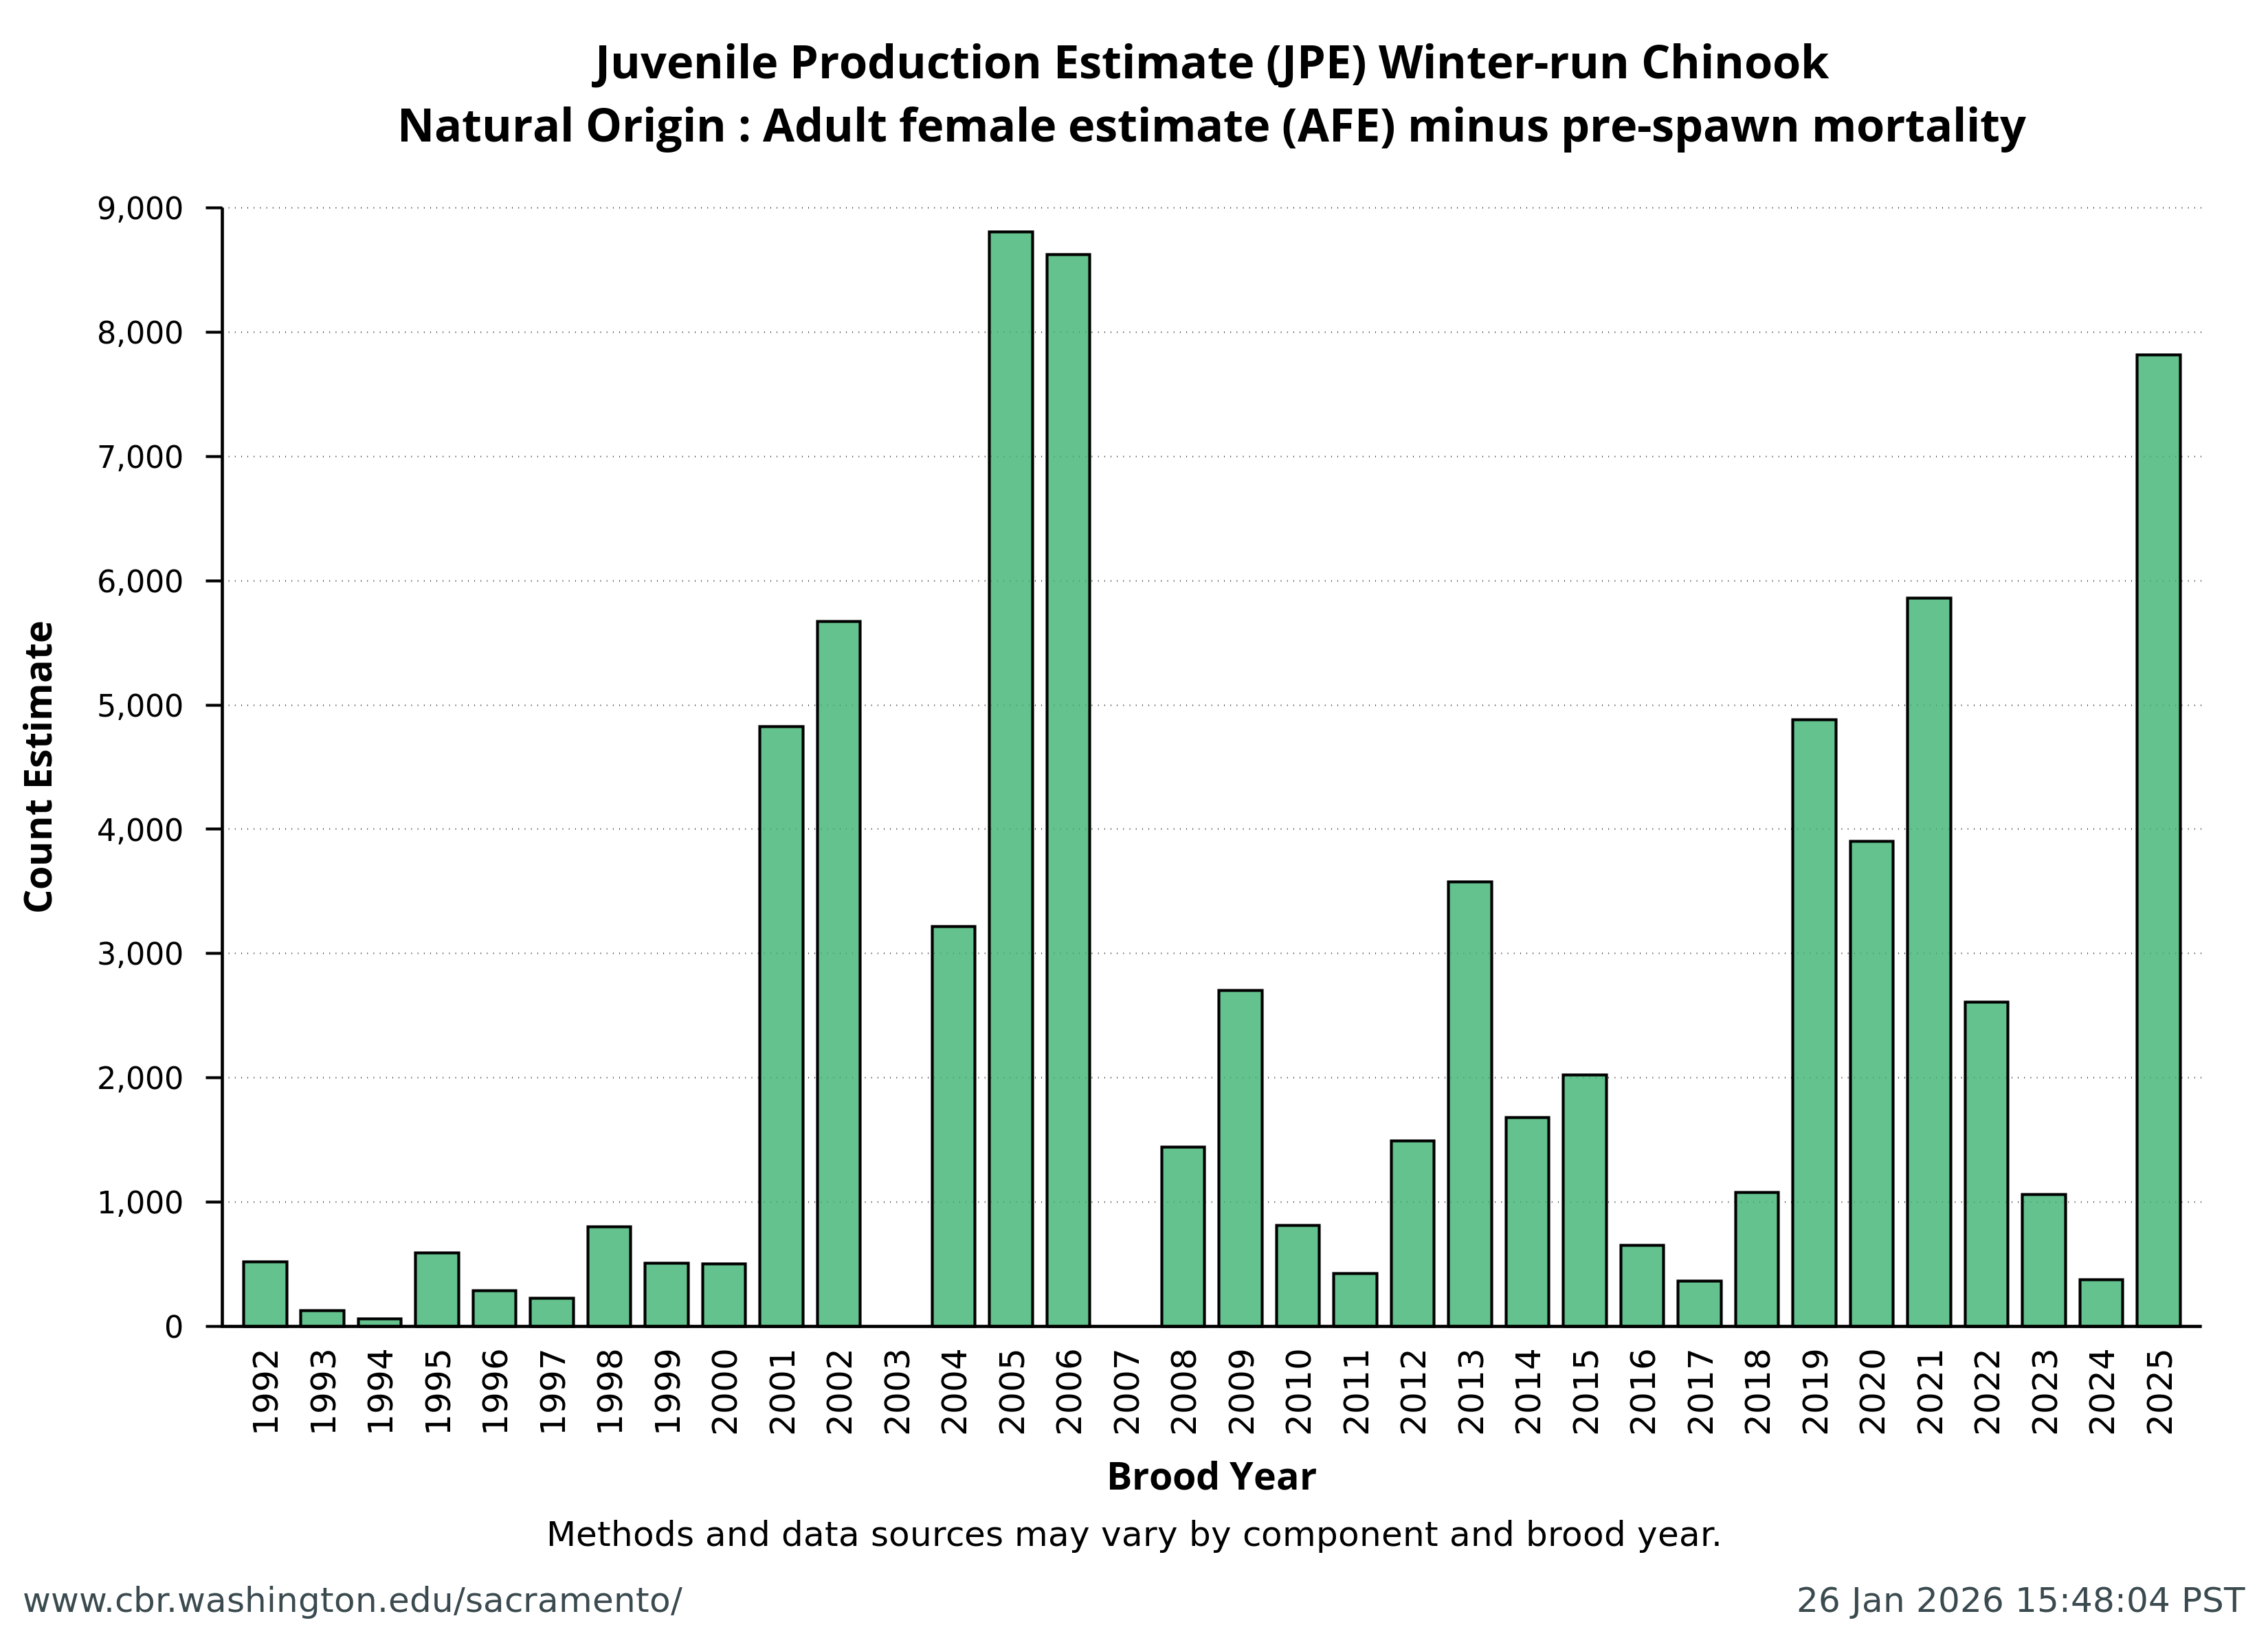
Natural Origin: Adult female estimate (AFE) minus pre-spawn mortality

| Brood Year | Value | Component | Origin | JPE letter date | Footnote* | References & Contributors | Lower 95% CI | Upper 95% CI |
|---|---|---|---|---|---|---|---|---|
| 1992 | 519 | Adult female estimate (AFE) minus pre-spawn mortality | Natural | 1993-02-09 | NA | CDFW, USFWS | NA | NA |
| 1993 | 129 | Adult female estimate (AFE) minus pre-spawn mortality | Natural | 1993-10-01 | NA | CDFW, USFWS | NA | NA |
| 1994 | 61 | Adult female estimate (AFE) minus pre-spawn mortality | Natural | 1995-02-21 | NA | CDFW, USFWS | NA | NA |
| 1995 | 594 | Adult female estimate (AFE) minus pre-spawn mortality | Natural | 1995-10-20 | NA | CDFW, USFWS | NA | NA |
| 1996 | 290 | Adult female estimate (AFE) minus pre-spawn mortality | Natural | 1997-02-10 | NA | CDFW, USFWS | NA | NA |
| 1997 | 228 | Adult female estimate (AFE) minus pre-spawn mortality | Natural | 1998-04-27 | NA | CDFW, USFWS | NA | NA |
| 1998 | 799 | Adult female estimate (AFE) minus pre-spawn mortality | Natural | 1999-02-26 | NA | CDFW, USFWS | NA | NA |
| 1999 | 509 | Adult female estimate (AFE) minus pre-spawn mortality | Natural | 2000-01-01 | NA | CDFW, USFWS | NA | NA |
| 2000 | 503 | Adult female estimate (AFE) minus pre-spawn mortality | Natural | 2001-01-29 | NA | CDFW, USFWS | NA | NA |
| 2001 | 4,828 | Adult female estimate (AFE) minus pre-spawn mortality | Natural | 2002-02-22 | "3/ Estimated mortality up to 1% from fresh carcass observations, DFG carcass survey 2001" | CDFW, USFWS | NA | NA |
| 2002 | 5,670 | Adult female estimate (AFE) minus pre-spawn mortality | Natural | 2003-02-19 | "3/ 2002 CDFG Carcass Survey estimated spawning success from fresh carcass observations (0.987)." | CDFW, USFWS | NA | NA |
| 2003 | NA | Adult female estimate (AFE) minus pre-spawn mortality | Natural | NA | NA | NA | NA | NA |
| 2004 | 3,218 | Adult female estimate (AFE) minus pre-spawn mortality | Natural | 2005-02-08 | NA | CDFW, USFWS | NA | NA |
| 2005 | 8,807 | Adult female estimate (AFE) minus pre-spawn mortality | Natural | 2006-02-10 | "3/ Pre-spawn mortality (# adult females x 2.2% unspawned) Alice Low, DFG, per.comm. WRSPWT 2005" | CDFW, USFWS | NA | NA |
| 2006 | 8,626 | Adult female estimate (AFE) minus pre-spawn mortality | Natural | 2007-02-15 | "3/ Pre-spawn mortality (2.1% of all fresh females) from Alice Low, DFG, per.comm. 1/16/07" | CDFW, USFWS | NA | NA |
| 2007 | NA | Adult female estimate (AFE) minus pre-spawn mortality | Natural | NA | NA | NA | NA | NA |
| 2008 | 1,443 | Adult female estimate (AFE) minus pre-spawn mortality | Natural | 2009-01-12 | "3/ Pre-spawn mortality =1.55%, or 6 of 387 females unspawned (D. Killam email 8/28/09)." | CDFW, USFWS | NA | NA |
| 2009 | 2,702 | Adult female estimate (AFE) minus pre-spawn mortality | Natural | 2010-02-24 | "3/ Pre-spawn mortality =0.54%, or 3 of 553 females unspawned (D. Killam email 1/28/10)." | CDFW, USFWS | NA | NA |
| 2010 | 813 | Adult female estimate (AFE) minus pre-spawn mortality | Natural | 2011-01-12 | "3/ Pre-spawn mortality =1.0%, or 8 of 822 females unspawned (from DFG carcass survey table)." | CDFW, USFWS | NA | NA |
| 2011 | 424 | Adult female estimate (AFE) minus pre-spawn mortality | Natural | 2012-01-26 | "3/ Pre-spawn mortality =0% in 2011, from DFG carcass survey table." | CDFW, USFWS | NA | NA |
| 2012 | 1,491 | Adult female estimate (AFE) minus pre-spawn mortality | Natural | 2013-01-31 | "3/ Pre-spawn mortality (7 of 602 females observed) in 2012, from CDFW final carcass estimate 12/3/12." | CDFW, USFWS | NA | NA |
| 2013 | 3,577 | Adult female estimate (AFE) minus pre-spawn mortality | Natural | 2014-02-21 | "3/ Pre-spawn mortality was estimated from carcass surveys of females (CDFW final estimate 12/15/13)." | CDFW, USFWS | NA | NA |
| 2014 | 1,681 | Adult female estimate (AFE) minus pre-spawn mortality | Natural | 2015-01-16 | "3/ Pre-spawn mortality was estimated from carcass surveys of females (CDFW)." | CDFW, USFWS | NA | NA |
| 2015 | 2,022 | Adult female estimate (AFE) minus pre-spawn mortality | Natural | 2016-01-28 | "3/ Pre-spawn mortality was estimated from carcass surveys of females (CDFW)." | CDFW, USFWS | NA | NA |
| 2016 | 653 | Adult female estimate (AFE) minus pre-spawn mortality | Natural | 2017-02-03 | "3/ Pre-spawn mortality was estimated from carcass surveys of females (CDFW)." | CDFW, USFWS | NA | NA |
| 2017 | 367 | Adult female estimate (AFE) minus pre-spawn mortality | Natural | 2018-01-08 | "3/ Pre-spawn mortality was estimated from carcass surveys of females (CDFW)." | CDFW, USFWS | NA | NA |
| 2018 | 1,080 | Adult female estimate (AFE) minus pre-spawn mortality | Natural | 2019-02-01 | "3/ Pre-spawn mortality was estimated from carcass surveys of females (CDFW)." | CDFW, USFWS | NA | NA |
| 2019 | 4,883 | Adult female estimate (AFE) minus pre-spawn mortality | Natural | 2020-01-23 | "3/ Pre-spawn mortality was estimated from carcass surveys of females (CDFW)." | CDFW, USFWS | NA | NA |
| 2020 | 3,904 | Adult female estimate (AFE) minus pre-spawn mortality | Natural | 2021-01-15 | "3/ Pre-spawn mortality was estimated from carcass surveys of females (CDFW)." | CDFW, USFWS | NA | NA |
| 2021 | 5,860 | Adult female estimate (AFE) minus pre-spawn mortality | Natural | 2022-01-14 | "3/ Pre-spawn mortality was estimated from carcass surveys of females (Doug Killam, CDFW, pers. comm.)." | CDFW, USFWS | NA | NA |
| 2022 | 2,607 | Adult female estimate (AFE) minus pre-spawn mortality | Natural | 2023-01-13 | "3/ Pre-spawn mortality was estimated from carcass surveys of females (Doug Killam, CDFW, pers. comm.)." | CDFW, USFWS | NA | NA |
| 2023 | 1,061 | Adult female estimate (AFE) minus pre-spawn mortality | Natural | 2024-01-12 | "3/ Pre-spawn mortality was estimated from carcass surveys of females (Doug Killam, CDFW, pers. comm.)." | CDFW, USFWS | NA | NA |
| 2024 | 375 | Adult female estimate (AFE) minus pre-spawn mortality | Natural | 2025-01-10 | "3/ Pre-spawn mortality was estimated from carcass surveys of females (Doug Killam, CDFW, pers. comm.)." | CDFW, USFWS | NA | NA |
| 2025 | 7,817 | Adult female estimate (AFE) minus pre-spawn mortality | Natural | 2026-01-08 | "3/ Pre-spawn mortality was estimated from carcass surveys of females (Doug Killam, CDFW, pers. comm.)." | CDFW, USFWS | NA | NA |
| *From Table 1 of "Final Winter-Run Juvenile Production Estimate Recommendation for Brood Year" letters from CDFW / Winter-run PWT to NMFS (Enclosures in JPE letters) | ||||||||
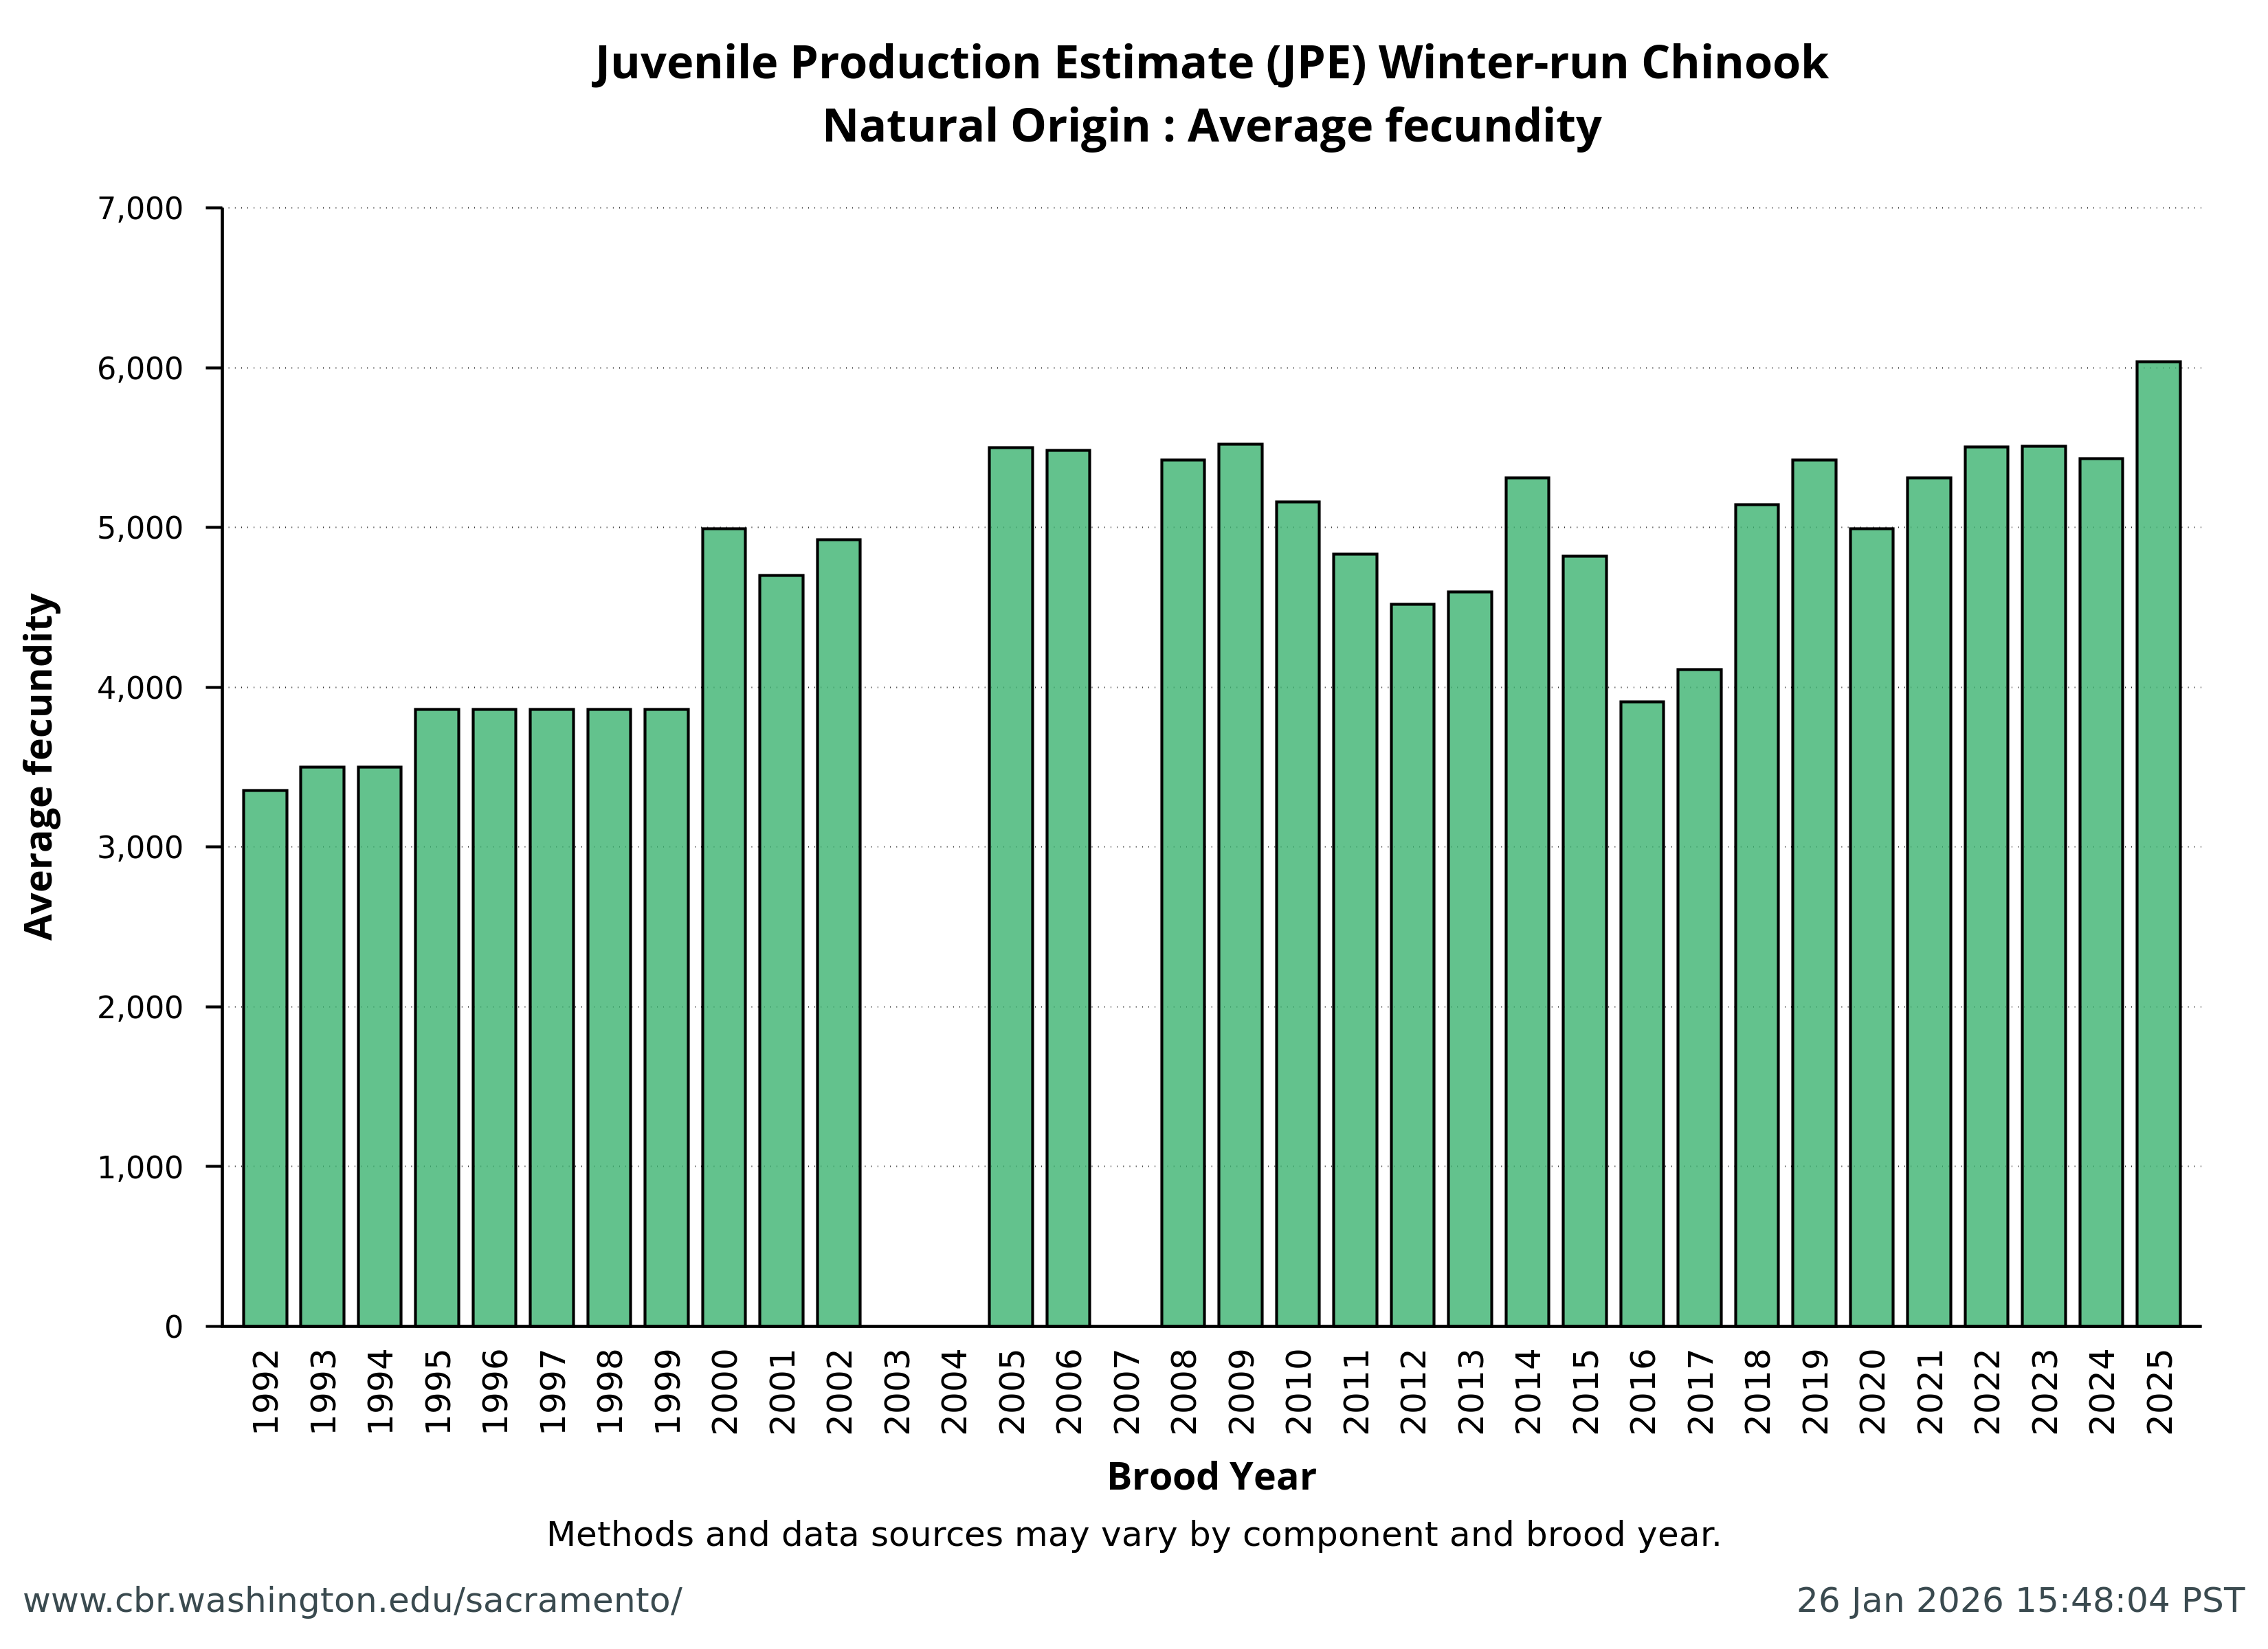
Natural Origin: Average fecundity

| Brood Year | Value | Component | Origin | JPE letter date | Footnote* | References & Contributors | Lower 95% CI | Upper 95% CI |
|---|---|---|---|---|---|---|---|---|
| 1992 | 3,353 | Average fecundity | Natural | 1993-02-09 | NA | LSNFH | NA | NA |
| 1993 | 3,500 | Average fecundity | Natural | 1993-10-01 | NA | LSNFH | NA | NA |
| 1994 | 3,500 | Average fecundity | Natural | 1995-02-21 | NA | LSNFH | NA | NA |
| 1995 | 3,859 | Average fecundity | Natural | 1995-10-20 | NA | LSNFH | NA | NA |
| 1996 | 3,859 | Average fecundity | Natural | 1997-02-10 | NA | LSNFH | NA | NA |
| 1997 | 3,859 | Average fecundity | Natural | 1998-04-27 | NA | LSNFH | NA | NA |
| 1998 | 3,859 | Average fecundity | Natural | 1999-02-26 | NA | LSNFH | NA | NA |
| 1999 | 3,859 | Average fecundity | Natural | 2000-01-01 | NA | LSNFH | NA | NA |
| 2000 | 4,990 | Average fecundity | Natural | 2001-01-29 | "3/ Average number of eggs per female derived from this year's spawning at Livingston Stone Hatchery (n=44)" | LSNFH | NA | NA |
| 2001 | 4,700 | Average fecundity | Natural | 2002-02-22 | "4/ Average fecundity rate from 2001 spawning at Livingston Stone Hatchery (n=50)" | LSNFH | NA | NA |
| 2002 | 4,923 | Average fecundity | Natural | 2003-02-19 | "4/ Number of eggs per adult female at LSNFH, broodyear 2002 records (n=47)." | LSNFH | NA | NA |
| 2003 | NA | Average fecundity | Natural | NA | NA | NA | NA | NA |
| 2004 | NA | Average fecundity | Natural | NA | NA | NA | NA | NA |
| 2005 | 5,500 | Average fecundity | Natural | 2006-02-10 | "4/ Eggs per adult female (n= 47), based on 2005 adult returns to Livingston Stone National Fish Hatchery." | LSNFH | NA | NA |
| 2006 | 5,484 | Average fecundity | Natural | 2007-02-15 | "4/ Eggs per adult female (n= 50), based on 2006 spawning at Livingston Stone National Fish Hatchery." | LSNFH | NA | NA |
| 2007 | NA | Average fecundity | Natural | NA | NA | NA | NA | NA |
| 2008 | 5,424 | Average fecundity | Natural | 2009-01-12 | "4/ Average eggs/female, 2008 returns to Livingston Stone National Fish Hatchery (n=48, STD 911)." | LSNFH | NA | NA |
| 2009 | 5,519 | Average fecundity | Natural | 2010-02-24 | "4/ Average eggs/female, 2009 hatchery returns (n=48) Table 2, USFWS pre-release report 1/25/10)." | LSNFH | NA | NA |
| 2010 | 5,161 | Average fecundity | Natural | 2011-01-12 | "4/ Average eggs/female, from 2010 returns to Livingston Stone National Fish Hatchery, John Rueth." | LSNFH | NA | NA |
| 2011 | 4,832 | Average fecundity | Natural | 2012-01-26 | "4/ Average eggs/female, based on 2011 return (n=45) to LSNFH from Kevin Niemela, FWS, 1/10/12." | LSNFH | NA | NA |
| 2012 | 4,518 | Average fecundity | Natural | 2013-01-31 | "4/ Average # eggs/female, from 2012 returns (n=47) to LSNFH, email from John Rueth, USFWS." | LSNFH | NA | NA |
| 2013 | 4,596 | Average fecundity | Natural | 2014-02-21 | "4/ Average # eggs/female, from 2013 returns to LSNFH (n=50), John Rueth, USFWS, email 12/13/13." | LSNFH | NA | NA |
| 2014 | 5,308 | Average fecundity | Natural | 2015-01-16 | "4/ Average # eggs/female from 175 females (including females less than 3 years old) collected from the 2014 returns to Livingston Stone" | LSNFH | NA | NA |
| 2015 | 4,819 | Average fecundity | Natural | 2016-01-28 | "4/ Average # eggs/female from 175 females (including females less than 3 years old) collected from the 2015 returns to Livingston Stone National Fish Hatchery." | LSNFH | NA | NA |
| 2016 | 3,907 | Average fecundity | Natural | 2017-02-03 | "4/ Average # eggs/female from weighted estimate based on two year and three old fish spawned at Livingston Stone Hatchery and in the carcass survey(Attachment A)." | LSNFH | NA | NA |
| 2017 | 4,109 | Average fecundity | Natural | 2018-01-08 | "4/ Preliminary (subject to change) average # of eggs/female from weighted estimate based on two year and three year old fish spawned at Livingston Stone Hatchery and from the carcass survey." | LSNFH | NA | NA |
| 2018 | 5,141 | Average fecundity | Natural | 2019-02-01 | "4/ Preliminary (subject to change) average number of eggs/female from 49 fish spawned at LSNFH" | LSNFH | NA | NA |
| 2019 | 5,424 | Average fecundity | Natural | 2020-01-23 | "4/ Preliminary (subject to change) average number of eggs per female from 56 female fish spawned at LSNFH (unpublished data)." | LSNFH | NA | NA |
| 2020 | 4,991 | Average fecundity | Natural | 2021-01-15 | "4/ Preliminary (subject to change) average number of eggs per female from 75 female fish spawned at LSNFH (Taylor Lipscomb, USFWS pers. comm.)." | LSNFH | NA | NA |
| 2021 | 5,312 | Average fecundity | Natural | 2022-01-14 | "4/ Preliminary (subject to change) average number of eggs per female from 118 female fish spawned at LSNFH (Kaitlin Gooding, USFWS pers. comm.)." | LSNFH | NA | NA |
| 2022 | 5,505 | Average fecundity | Natural | 2023-01-13 | "4/ Preliminary (subject to change) average number of eggs per female from fish spawned (n=169) at LSNFH (Kaitlin Dunham, USFWS pers. comm.)." | LSNFH | NA | NA |
| 2023 | 5,510 | Average fecundity | Natural | 2024-01-12 | "4/ Preliminary (subject to change) average number of eggs per female from fish spawned (n=179) at LSNFH (Kaitlin Dunham, USFWS pers. comm.)." | LSNFH | NA | NA |
| 2024 | 5,430 | Average fecundity | Natural | 2025-01-10 | "4/ Preliminary (subject to change) average number of eggs per female from fish spawned (n=120) at LSNFH (Kaitlin Dunham, USFWS pers. comm.)." | LSNFH | NA | NA |
| 2025 | 6,037 | Average fecundity | Natural | 2026-01-08 | "4/ Preliminary (subject to change) average number of eggs per female from fish spawned (n=107) at LSNFH (Kaitlin Dunham, USFWS pers. comm.)." | LSNFH | NA | NA |
| *From Table 1 of "Final Winter-Run Juvenile Production Estimate Recommendation for Brood Year" letters from CDFW / Winter-run PWT to NMFS (Enclosures in JPE letters) | ||||||||
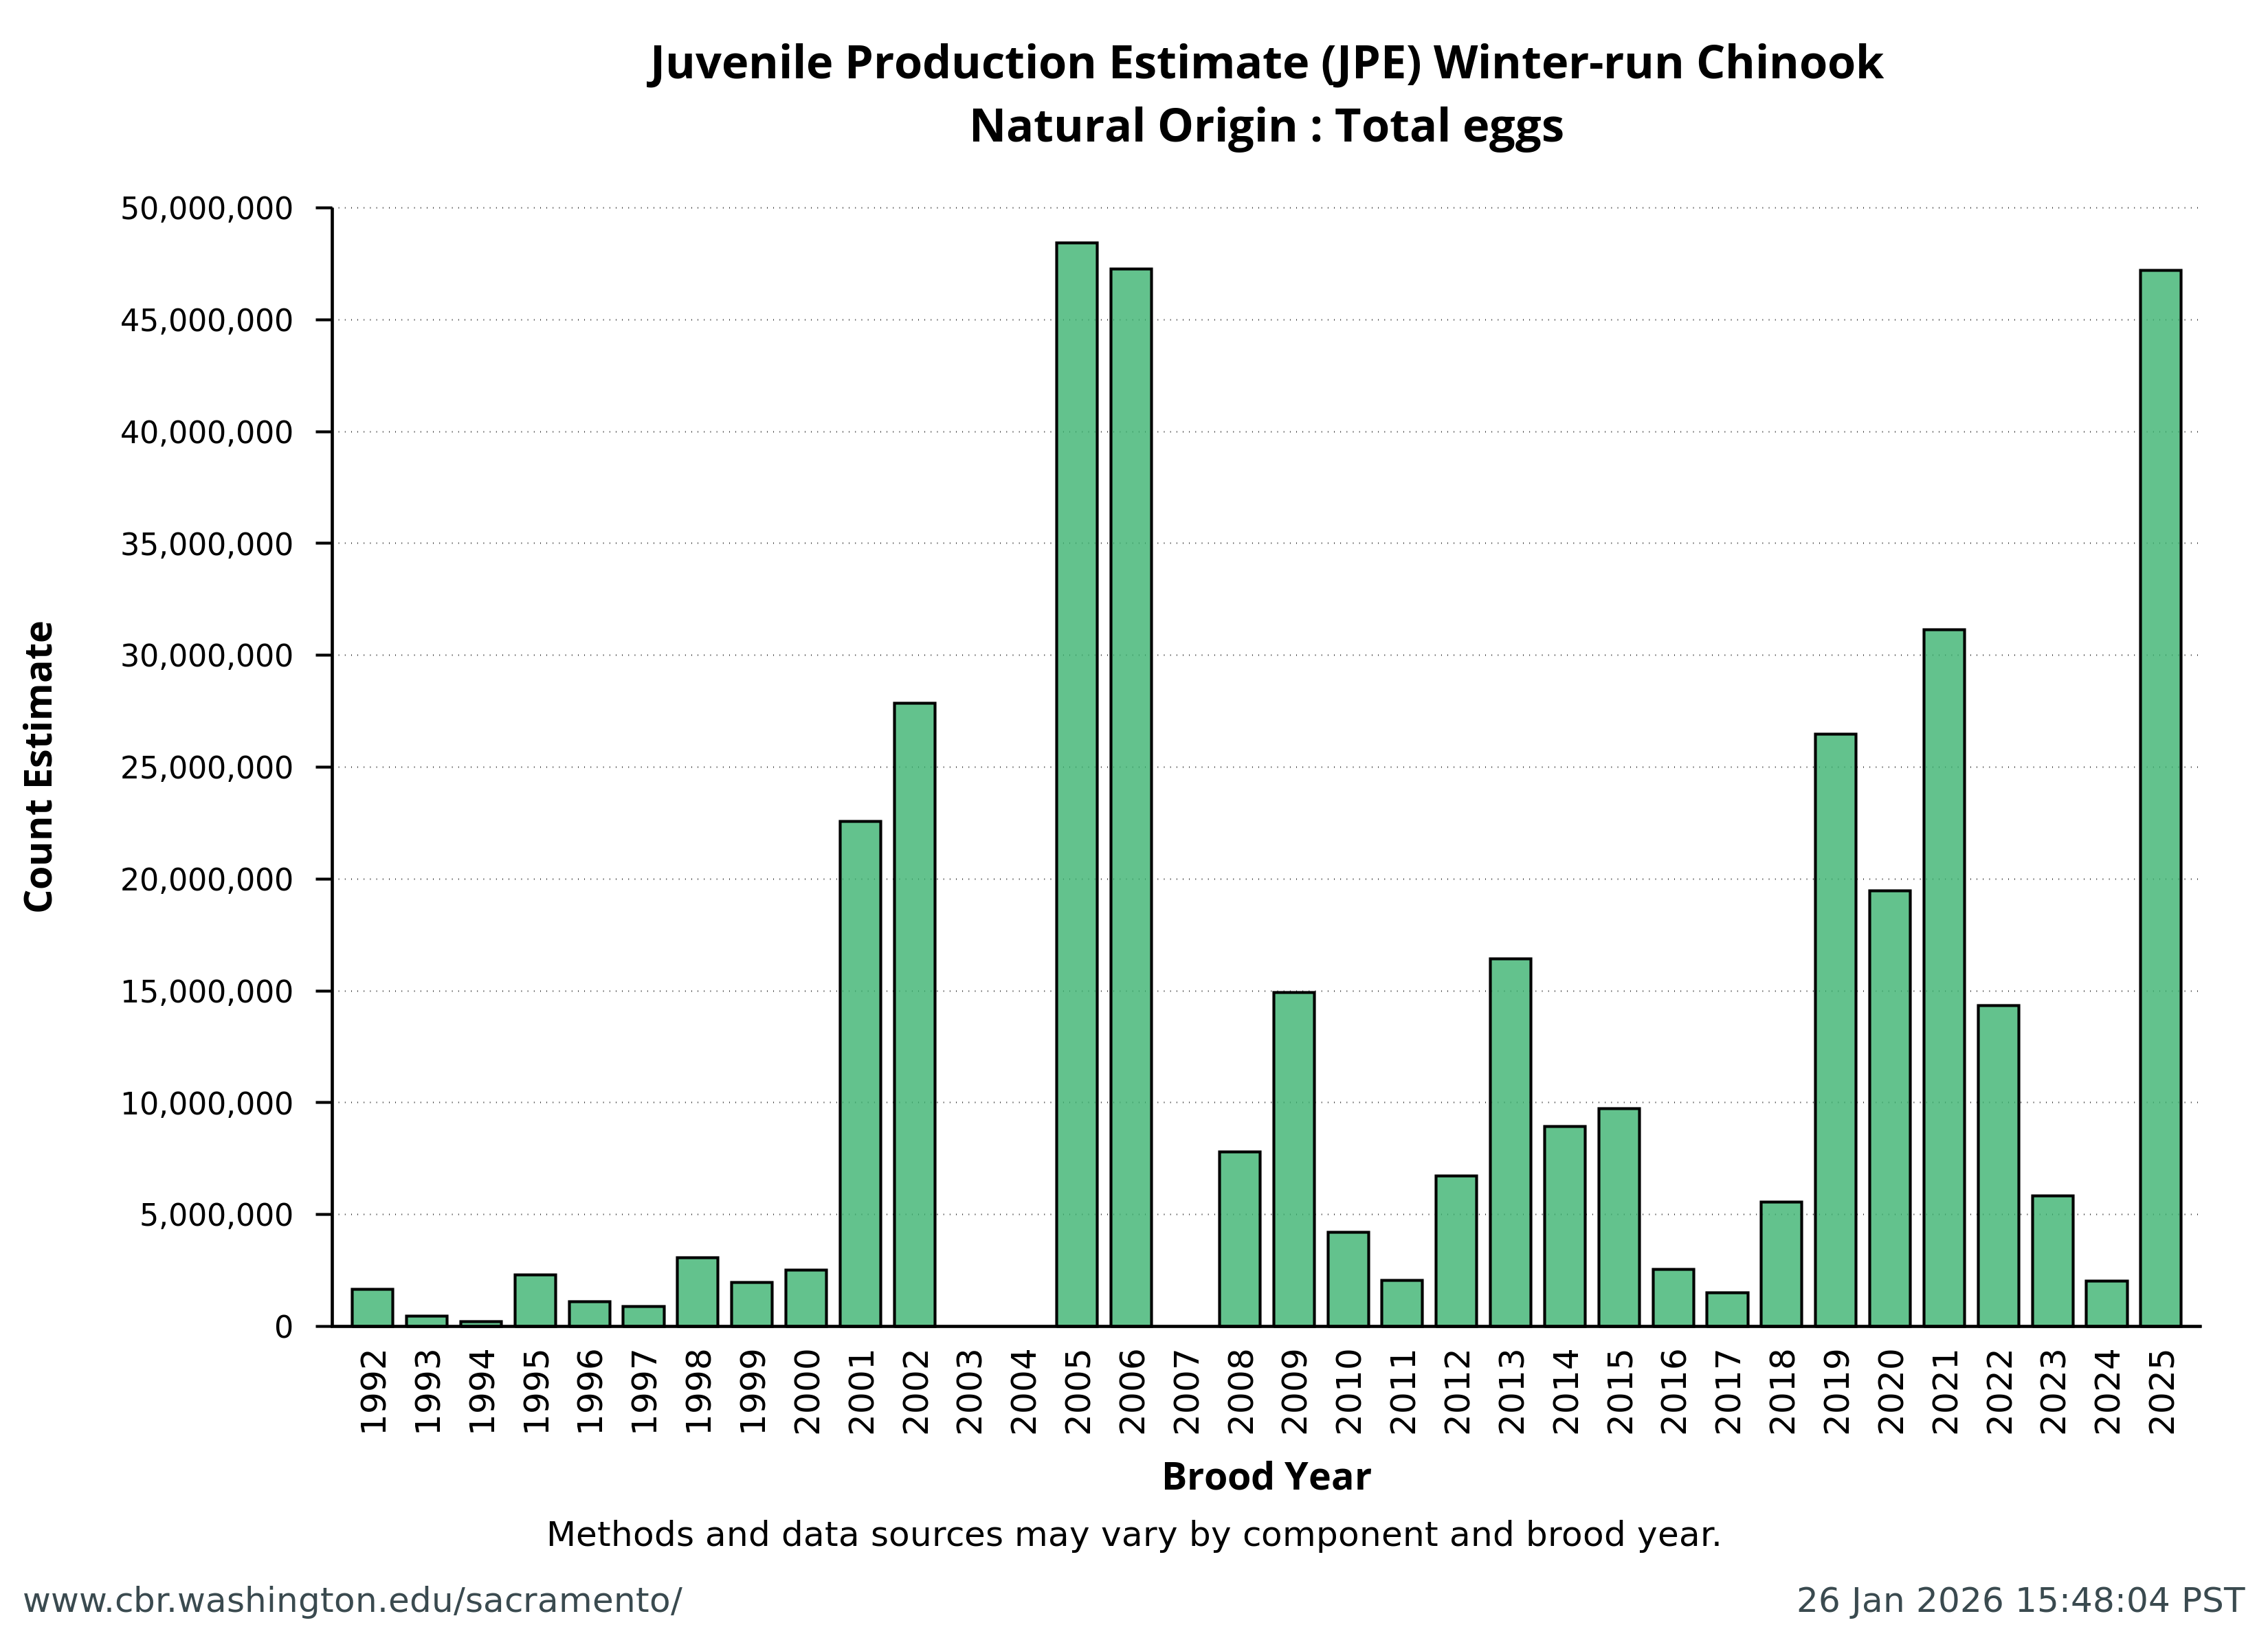
Natural Origin: Total eggs

| Brood Year | Value | Component | Origin | JPE letter date | Footnote | References & Contributors | Lower 95% CI | Upper 95% CI |
|---|---|---|---|---|---|---|---|---|
| 1992 | 1,668,859 | Total eggs | Natural | 1993-02-09 | NA | CDFW, LSNFH, USFWS | NA | NA |
| 1993 | 451,092 | Total eggs | Natural | 1993-10-01 | NA | CDFW, LSNFH, USFWS | NA | NA |
| 1994 | 213,500 | Total eggs | Natural | 1995-02-21 | NA | CDFW, LSNFH, USFWS | NA | NA |
| 1995 | 2,292,246 | Total eggs | Natural | 1995-10-20 | NA | CDFW, LSNFH, USFWS | NA | NA |
| 1996 | 1,119,110 | Total eggs | Natural | 1997-02-10 | NA | CDFW, LSNFH, USFWS | NA | NA |
| 1997 | 879,852 | Total eggs | Natural | 1998-04-27 | NA | CDFW, LSNFH, USFWS | NA | NA |
| 1998 | 3,083,341 | Total eggs | Natural | 1999-02-26 | NA | CDFW, LSNFH, USFWS | NA | NA |
| 1999 | 1,964,231 | Total eggs | Natural | 2000-01-01 | NA | CDFW, LSNFH, USFWS | NA | NA |
| 2000 | 2,509,970 | Total eggs | Natural | 2001-01-29 | NA | CDFW, LSNFH, USFWS | NA | NA |
| 2001 | 22,576,291 | Total eggs | Natural | 2002-02-22 | NA | CDFW, LSNFH, USFWS | NA | NA |
| 2002 | 27,858,505 | Total eggs | Natural | 2003-02-19 | NA | CDFW, LSNFH, USFWS | NA | NA |
| 2003 | NA | Total eggs | Natural | NA | NA | NA | NA | NA |
| 2004 | NA | Total eggs | Natural | NA | NA | NA | NA | NA |
| 2005 | 48,437,895 | Total eggs | Natural | 2006-02-10 | NA | CDFW, LSNFH, USFWS | NA | NA |
| 2006 | 47,272,022 | Total eggs | Natural | 2007-02-15 | NA | CDFW, LSNFH, USFWS | NA | NA |
| 2007 | NA | Total eggs | Natural | NA | NA | NA | NA | NA |
| 2008 | 7,810,463 | Total eggs | Natural | 2009-01-12 | NA | CDFW, LSNFH, USFWS | NA | NA |
| 2009 | 14,913,776 | Total eggs | Natural | 2010-02-24 | NA | CDFW, LSNFH, USFWS | NA | NA |
| 2010 | 4,197,541 | Total eggs | Natural | 2011-01-12 | NA | CDFW, LSNFH, USFWS | NA | NA |
| 2011 | 2,048,968 | Total eggs | Natural | 2012-01-26 | NA | CDFW, LSNFH, USFWS | NA | NA |
| 2012 | 6,736,155 | Total eggs | Natural | 2013-01-31 | NA | CDFW, LSNFH, USFWS | NA | NA |
| 2013 | 16,439,295 | Total eggs | Natural | 2014-02-21 | NA | CDFW, LSNFH, USFWS | NA | NA |
| 2014 | 8,922,854 | Total eggs | Natural | 2015-01-16 | NA | CDFW, LSNFH, USFWS | NA | NA |
| 2015 | 9,742,765 | Total eggs | Natural | 2016-01-28 | NA | CDFW, LSNFH, USFWS | NA | NA |
| 2016 | 2,551,585 | Total eggs | Natural | 2017-02-03 | NA | CDFW, LSNFH, USFWS | NA | NA |
| 2017 | 1,507,924 | Total eggs | Natural | 2018-01-08 | NA | CDFW, LSNFH, USFWS | NA | NA |
| 2018 | 5,552,280 | Total eggs | Natural | 2019-02-01 | NA | CDFW, LSNFH, USFWS | NA | NA |
| 2019 | 26,485,392 | Total eggs | Natural | 2020-01-23 | NA | CDFW, LSNFH, USFWS | NA | NA |
| 2020 | 19,484,864 | Total eggs | Natural | 2021-01-15 | NA | CDFW, LSNFH, USFWS | NA | NA |
| 2021 | 31,128,320 | Total eggs | Natural | 2022-01-14 | NA | CDFW, LSNFH, USFWS | NA | NA |
| 2022 | 14,351,535 | Total eggs | Natural | 2023-01-13 | NA | CDFW, LSNFH, USFWS | NA | NA |
| 2023 | 5,846,110 | Total eggs | Natural | 2024-01-12 | NA | CDFW, LSNFH, USFWS | NA | NA |
| 2024 | 2,036,250 | Total eggs | Natural | 2025-01-10 | NA | CDFW, LSNFH, USFWS | NA | NA |
| 2025 | 47,191,229 | Total eggs | Natural | 2026-01-08 | NA | CDFW, LSNFH, USFWS | NA | NA |
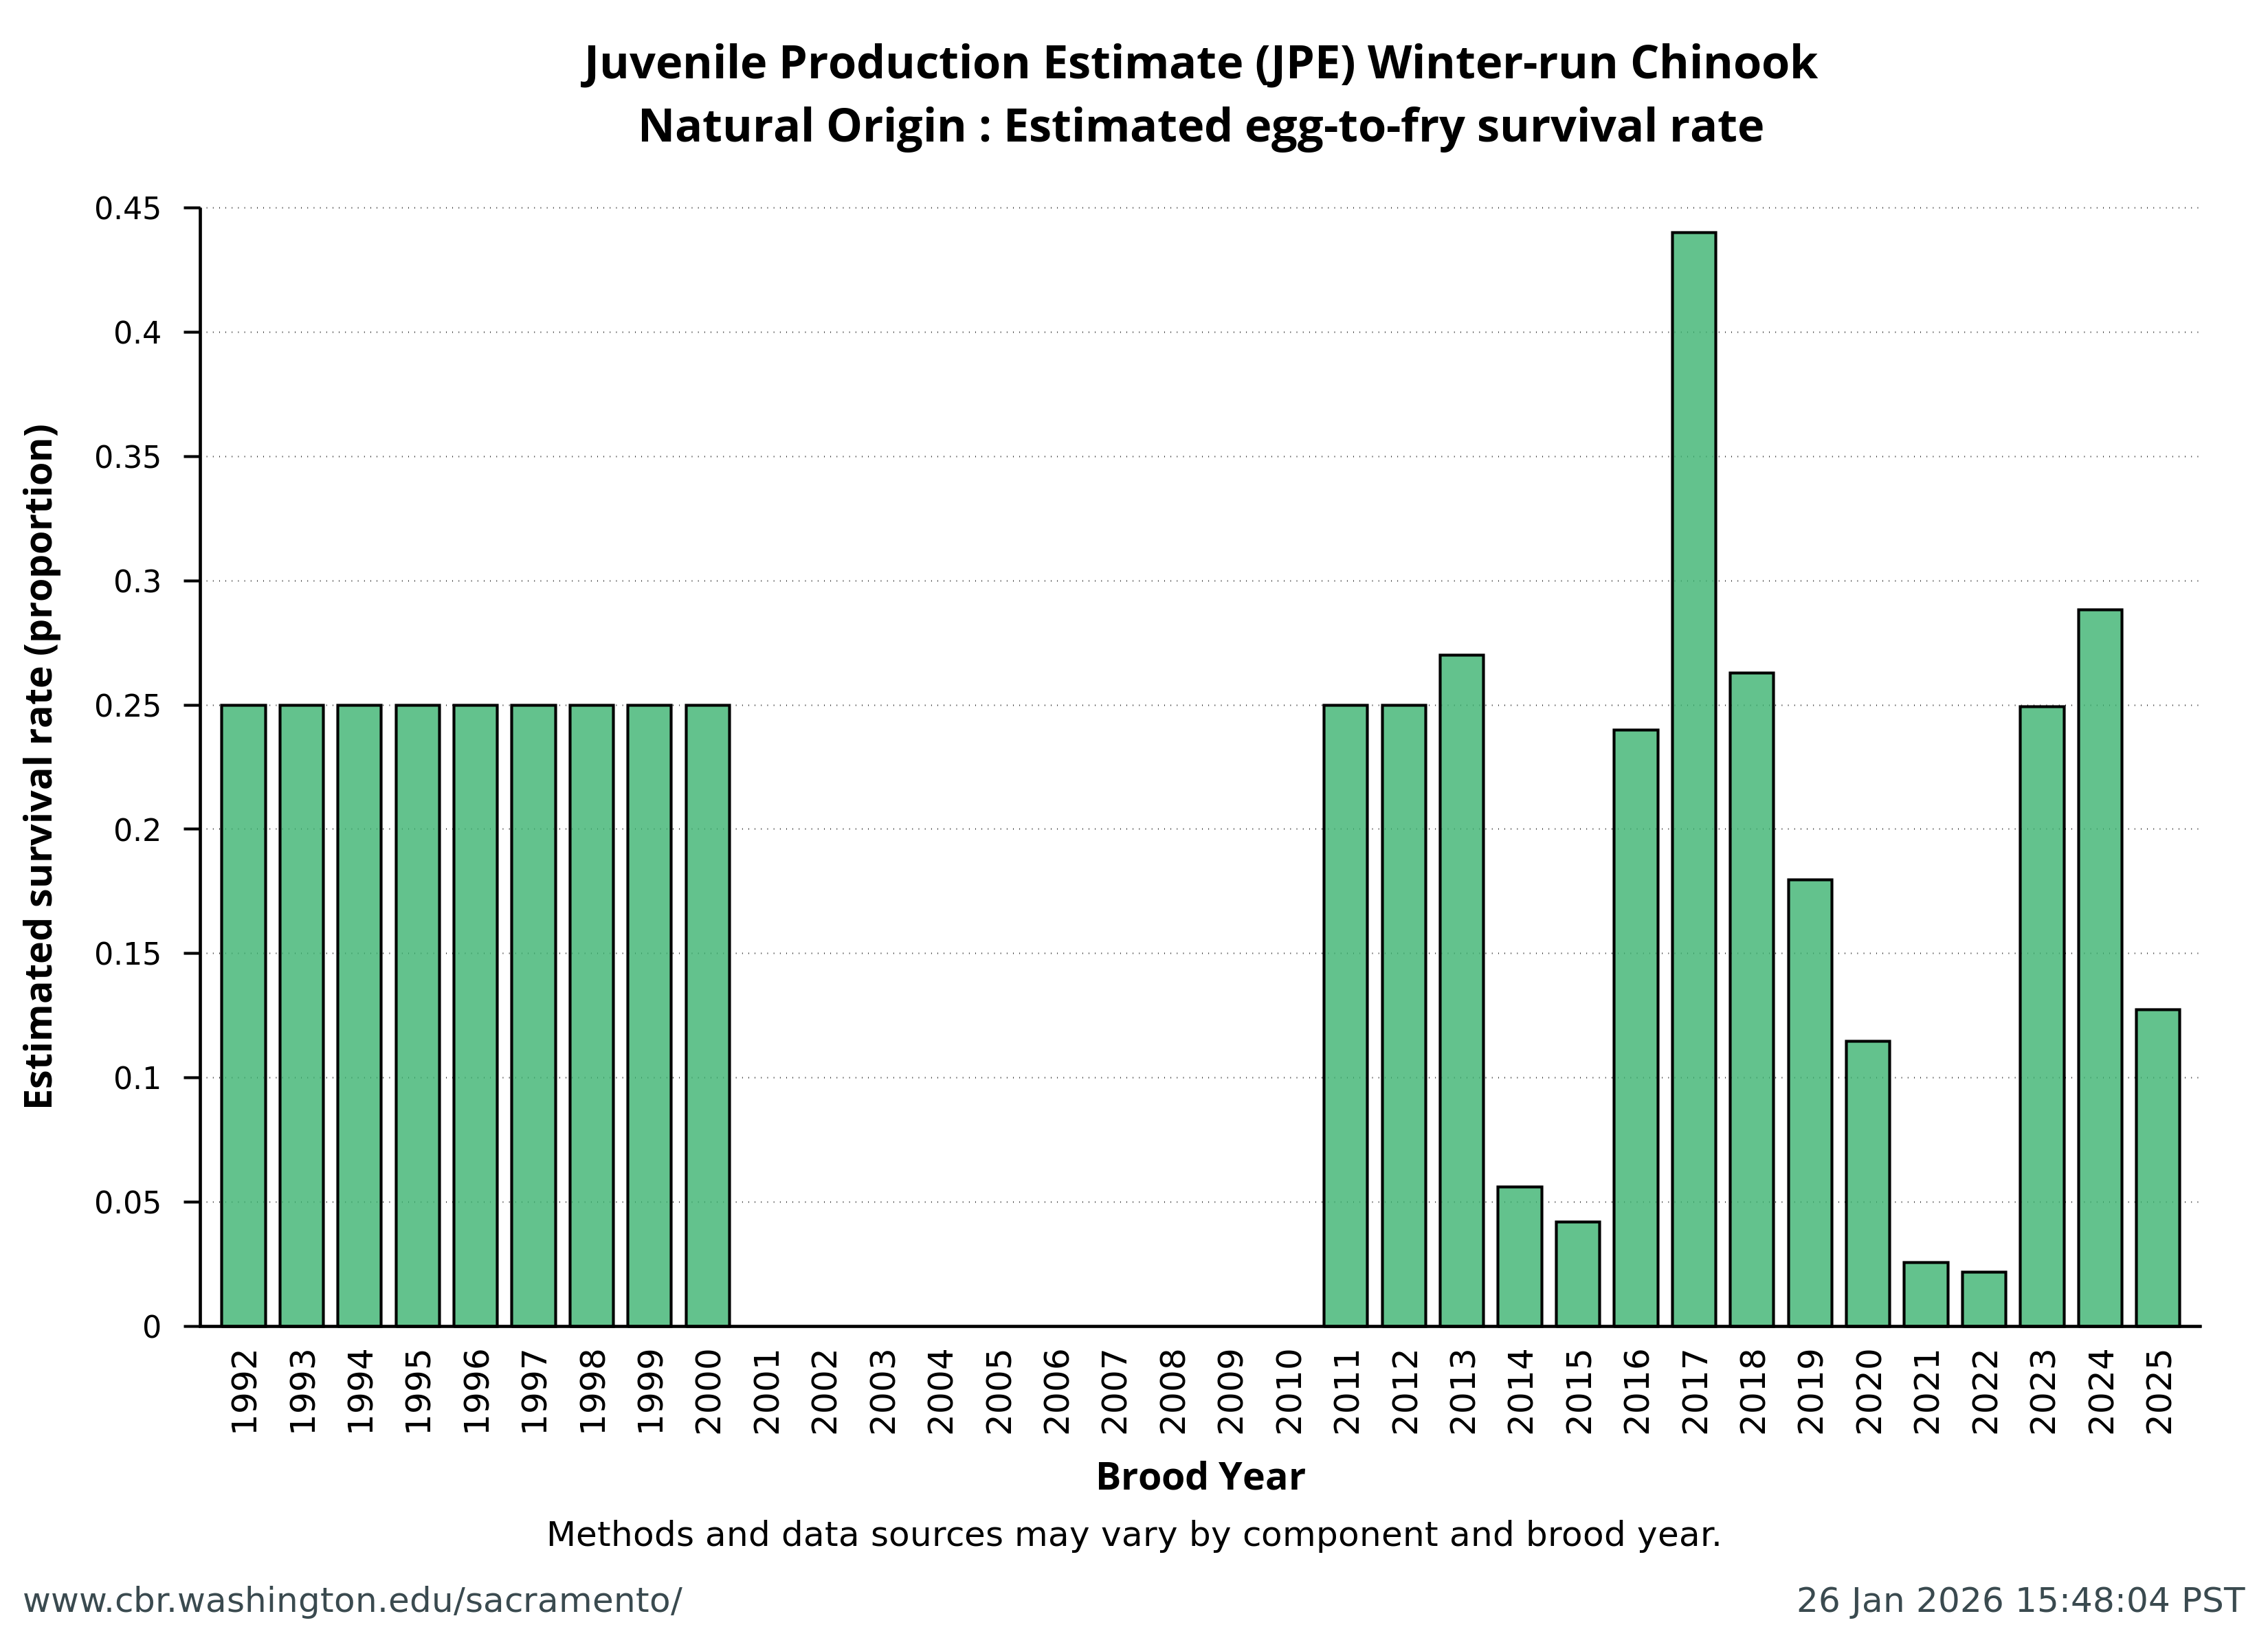
Natural Origin: Estimated egg-to-fry survival rate

| Brood Year | Value | Component | Origin | JPE letter date | Footnote* | References & Contributors | Lower 95% CI | Upper 95% CI |
|---|---|---|---|---|---|---|---|---|
| 1992 | 0.25 | Estimated egg-to-fry survival rate | Natural | 1993-02-09 | NA | CDFW, LSNFH, USFWS | NA | NA |
| 1993 | 0.25 | Estimated egg-to-fry survival rate | Natural | 1993-10-01 | NA | CDFW, LSNFH, USFWS | NA | NA |
| 1994 | 0.25 | Estimated egg-to-fry survival rate | Natural | 1995-02-21 | NA | CDFW, LSNFH, USFWS | NA | NA |
| 1995 | 0.25 | Estimated egg-to-fry survival rate | Natural | 1995-10-20 | NA | CDFW, LSNFH, USFWS | NA | NA |
| 1996 | 0.25 | Estimated egg-to-fry survival rate | Natural | 1997-02-10 | NA | CDFW, LSNFH, USFWS | NA | NA |
| 1997 | 0.25 | Estimated egg-to-fry survival rate | Natural | 1998-04-27 | NA | CDFW, LSNFH, USFWS | NA | NA |
| 1998 | 0.25 | Estimated egg-to-fry survival rate | Natural | 1999-02-26 | NA | CDFW, LSNFH, USFWS | NA | NA |
| 1999 | 0.25 | Estimated egg-to-fry survival rate | Natural | 2000-01-01 | NA | CDFW, LSNFH, USFWS | NA | NA |
| 2000 | 0.25 | Estimated egg-to-fry survival rate | Natural | 2001-01-29 | NA | CDFW, LSNFH, USFWS | NA | NA |
| 2001 | NA | Estimated egg-to-fry survival rate | Natural | NA | NA | NA | NA | NA |
| 2002 | NA | Estimated egg-to-fry survival rate | Natural | NA | NA | NA | NA | NA |
| 2003 | NA | Estimated egg-to-fry survival rate | Natural | NA | NA | NA | NA | NA |
| 2004 | NA | Estimated egg-to-fry survival rate | Natural | NA | NA | NA | NA | NA |
| 2005 | NA | Estimated egg-to-fry survival rate | Natural | NA | NA | NA | NA | NA |
| 2006 | NA | Estimated egg-to-fry survival rate | Natural | NA | NA | NA | NA | NA |
| 2007 | NA | Estimated egg-to-fry survival rate | Natural | NA | NA | NA | NA | NA |
| 2008 | NA | Estimated egg-to-fry survival rate | Natural | NA | NA | NA | NA | NA |
| 2009 | NA | Estimated egg-to-fry survival rate | Natural | NA | NA | NA | NA | NA |
| 2010 | NA | Estimated egg-to-fry survival rate | Natural | NA | NA | NA | NA | NA |
| 2011 | 0.25 | Estimated egg-to-fry survival rate | Natural | 2012-01-26 | "6/ This is measured at Red Bluff based on female spawners, carcass survey females, JPI/female spawner, and fecundity data (J. Smith, FWS, 12/7/11 WRPWT notes)" | CDFW, LSNFH, USFWS | NA | NA |
| 2012 | 0.25 | Estimated egg-to-fry survival rate | Natural | 2013-01-31 | "6/ Survival measured at Red Bluff based on JPI/female spawners in carcass survey, and fecundity data (J. Smith, USFWS, 12/7/11 WRPWT notes)" | CDFW, LSNFH, USFWS | NA | NA |
| 2013 | 0.27 | Estimated egg-to-fry survival rate | Natural | 2014-02-21 | NA | CDFW, LSNFH, USFWS | NA | NA |
| 2014 | 0.056 | Estimated egg-to-fry survival rate | Natural | 2015-01-16 | NA | CDFW, LSNFH, USFWS | NA | NA |
| 2015 | 0.042 | Estimated egg-to-fry survival rate | Natural | 2016-01-28 | NA | CDFW, LSNFH, USFWS | NA | NA |
| 2016 | 0.24 | Estimated egg-to-fry survival rate | Natural | 2017-02-03 | NA | CDFW, LSNFH, USFWS | NA | NA |
| 2017 | 0.44 | Estimated egg-to-fry survival rate | Natural | 2018-01-08 | NA | CDFW, LSNFH, USFWS | NA | NA |
| 2018 | 0.263 | Estimated egg-to-fry survival rate | Natural | 2019-02-01 | "5/ Back calculated estimated survival between eggs laid in-river and fry production estimates at RBDD based on numbers of fry equivalents (JPI) using traditional (59%) fry-to-smolt survival estimates" | CDFW, LSNFH, USFWS | NA | NA |
| 2019 | 0.1798 | Estimated egg-to-fry survival rate | Natural | 2020-01-23 | "5/ Back calculated estimated survival between eggs laid in-river and fry production estimates at RBDD based on numbers of fry equivalents (JPI) using the 0.4651 fry-to-smolt survival rate estimate based on method described in O’Farrell et al. (2018)." | CDFW, LSNFH, USFWS | NA | NA |
| 2020 | 0.1146 | Estimated egg-to-fry survival rate | Natural | 2021-01-15 | "5/ Back-calculated estimated survival between eggs laid in-river and fry production estimates at RBDD based on numbers of fry equivalents (JPI) using the 0.4475 fry-to-smolt survival rate estimate method described in O’Farrell et al. (2018)." | CDFW, LSNFH, USFWS | NA | NA |
| 2021 | 0.0256 | Estimated egg-to-fry survival rate | Natural | 2022-01-14 | "5/ Back calculated survival between estimated eggs laid in-river and fry production estimates at RBDD based on numbers of fry equivalents (JPI) using the 0.4429 fry-to-smolt survival rate estimate based on method described in O’Farrell et al. (2018)." | CDFW, LSNFH, USFWS | NA | NA |
| 2022 | 0.0217 | Estimated egg-to-fry survival rate | Natural | 2023-01-13 | "5/ Back calculated estimated survival between eggs laid in-river and fry production estimates at RBDD based on numbers of fry equivalents (JPI) using the 0.4946 fry-to-smolt survival rate estimate based on method described in O’Farrell et al. (2018)." | CDFW, LSNFH, USFWS | NA | NA |
| 2023 | 0.2494 | Estimated egg-to-fry survival rate | Natural | 2024-01-12 | "5/ Back calculated estimated survival between eggs laid in-river and fry production estimates at RBDD based on numbers of fry equivalents (JPI) using the 0.5066 fry-to-smolt survival rate estimate based on method described in O’Farrell et al. (2018)." | CDFW, LSNFH, USFWS | NA | NA |
| 2024 | 0.2884 | Estimated egg-to-fry survival rate | Natural | 2025-01-10 | "5/ Back calculated estimated survival between eggs laid in-river and fry production estimates at RBDD based on numbers of fry equivalents (JPI) using the 0.5149 fry-to-smolt survival rate estimate based on method described in O’Farrell et al. (2018)" | CDFW, LSNFH, USFWS | NA | NA |
| 2025 | 0.1273 | Estimated egg-to-fry survival rate | Natural | 2026-01-08 | "5/ Back calculated estimated survival between eggs laid in-river and fry production estimates at RBDD based on numbers of fry equivalents (JPI) using the 0.5217 fry-to-smolt survival rate estimate based on method described in O’Farrell et al. (2018)." | CDFW, LSNFH, USFWS | NA | NA |
| *From Table 1 of "Final Winter-Run Juvenile Production Estimate Recommendation for Brood Year" letters from CDFW / Winter-run PWT to NMFS (Enclosures in JPE letters) | ||||||||
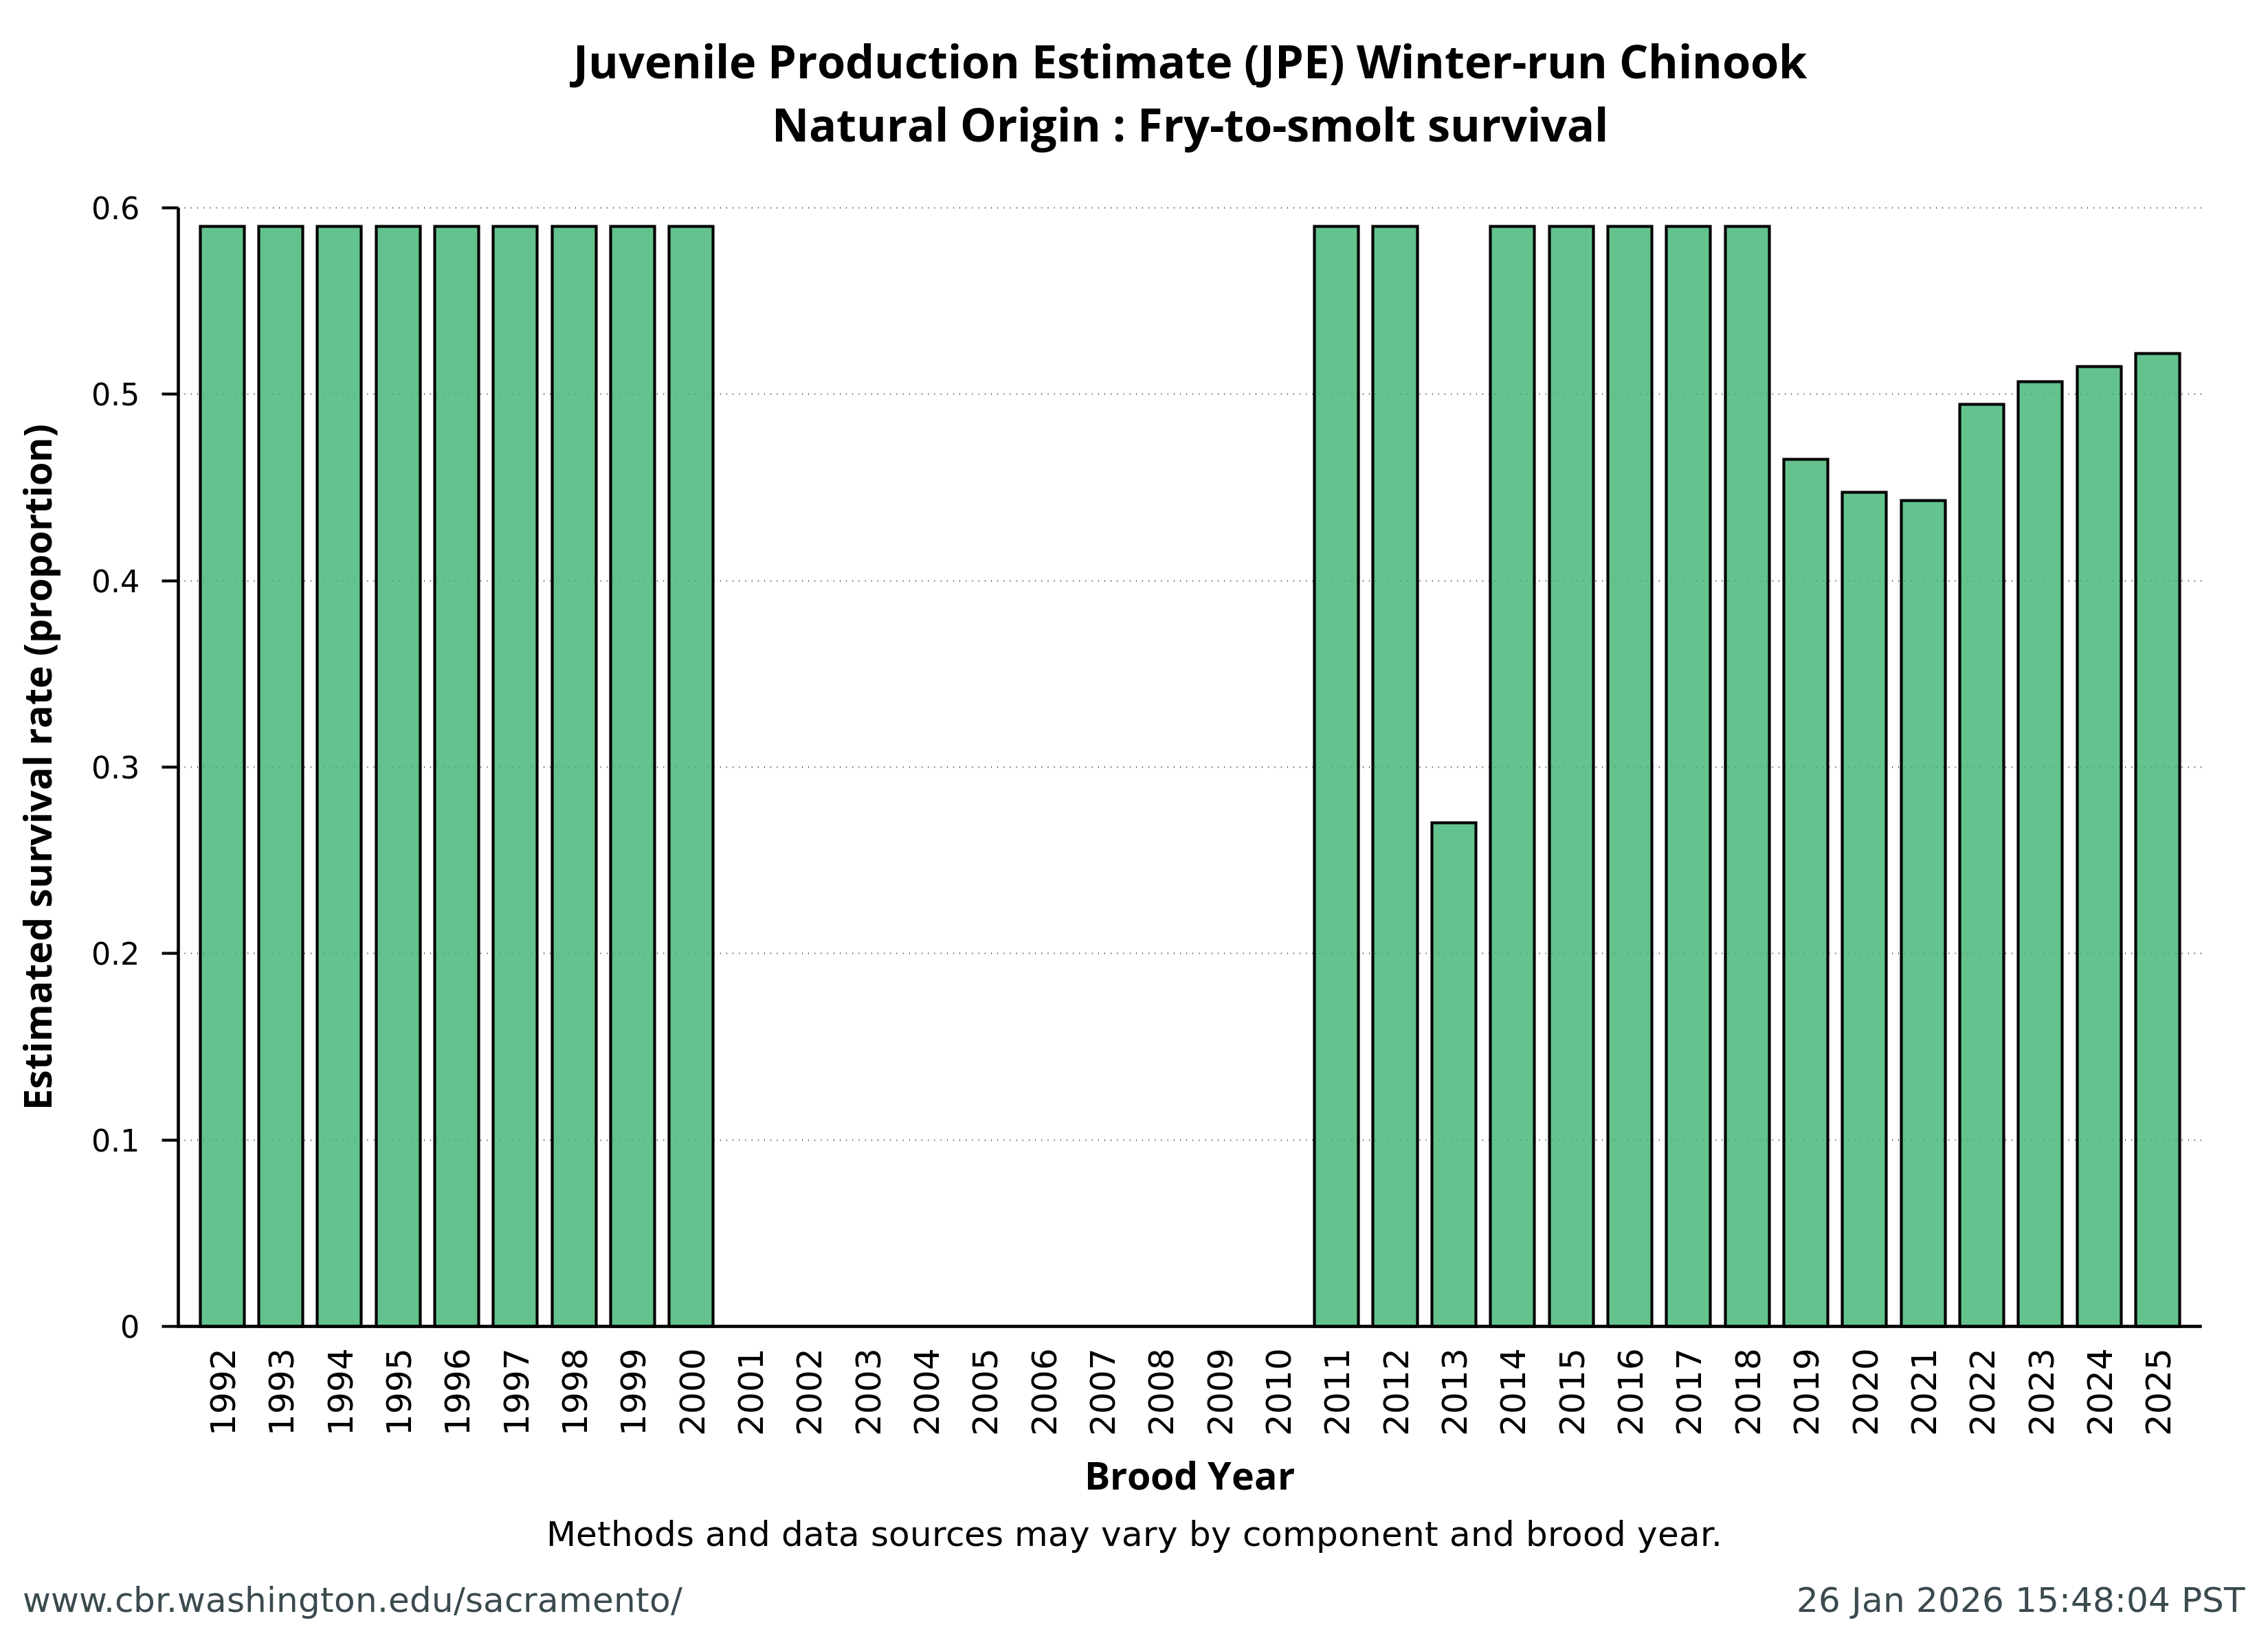
Natural Origin: Fry-to-smolt survival

| Brood Year | Value | Component | Origin | JPE letter date | Footnote* | References & Contributors | Lower 95% CI | Upper 95% CI |
|---|---|---|---|---|---|---|---|---|
| 1992 | 0.59 | Fry-to-smolt survival | Natural | 1993-02-09 | NA | NA | NA | NA |
| 1993 | 0.59 | Fry-to-smolt survival | Natural | 1993-10-01 | NA | NA | NA | NA |
| 1994 | 0.59 | Fry-to-smolt survival | Natural | 1995-02-21 | NA | NA | NA | NA |
| 1995 | 0.59 | Fry-to-smolt survival | Natural | 1995-10-20 | NA | NA | NA | NA |
| 1996 | 0.59 | Fry-to-smolt survival | Natural | 1997-02-10 | NA | NA | NA | NA |
| 1997 | 0.59 | Fry-to-smolt survival | Natural | 1998-04-27 | NA | NA | NA | NA |
| 1998 | 0.59 | Fry-to-smolt survival | Natural | 1999-02-26 | NA | NA | NA | NA |
| 1999 | 0.59 | Fry-to-smolt survival | Natural | 2000-01-01 | NA | NA | NA | NA |
| 2000 | 0.59 | Fry-to-smolt survival | Natural | 2001-01-29 | NA | NA | NA | NA |
| 2001 | NA | Fry-to-smolt survival | Natural | NA | NA | NA | NA | NA |
| 2002 | NA | Fry-to-smolt survival | Natural | NA | NA | NA | NA | NA |
| 2003 | NA | Fry-to-smolt survival | Natural | NA | NA | NA | NA | NA |
| 2004 | NA | Fry-to-smolt survival | Natural | NA | NA | NA | NA | NA |
| 2005 | NA | Fry-to-smolt survival | Natural | NA | NA | NA | NA | NA |
| 2006 | NA | Fry-to-smolt survival | Natural | NA | NA | NA | NA | NA |
| 2007 | NA | Fry-to-smolt survival | Natural | NA | NA | NA | NA | NA |
| 2008 | NA | Fry-to-smolt survival | Natural | NA | NA | NA | NA | NA |
| 2009 | NA | Fry-to-smolt survival | Natural | NA | NA | NA | NA | NA |
| 2010 | NA | Fry-to-smolt survival | Natural | NA | NA | NA | NA | NA |
| 2011 | 0.59 | Fry-to-smolt survival | Natural | 2012-01-26 | "7/ This number (0.59) previously had been multiplied into the estimated survival- Egg to Smolt" | NA | NA | NA |
| 2012 | 0.59 | Fry-to-smolt survival | Natural | 2013-01-31 | "7/ This survival rate (0.59) previously had been multiplied into the Egg to Smolt survival" | NA | NA | NA |
| 2013 | 0.27 | Fry-to-smolt survival | Natural | 2014-02-21 | "7/ Weighted average (50/50) of winter-run (2013) and late-fall run (2007-2010) acoustic tag data." | NA | NA | NA |
| 2014 | 0.59 | Fry-to-smolt survival | Natural | 2015-01-16 | "9/ Estimate of fry to smolt survival based on fall run at Tehama Colusa Fish Facility (Hallock undated)" | NA | NA | NA |
| 2015 | 0.59 | Fry-to-smolt survival | Natural | 2016-01-28 | "6/ Estimate of fry-to-smolt survival based on fall-run at Tehama Colusa Spawning Channel (Hallock updated)" | NA | NA | NA |
| 2016 | 0.59 | Fry-to-smolt survival | Natural | 2017-02-03 | "6/ Estimate of fry-to-smolt survival based on fall-run at Tehama Colusa Spawning Channel (Hallock updated)" | NA | NA | NA |
| 2017 | 0.59 | Fry-to-smolt survival | Natural | 2018-01-08 | "6/ Estimate of fry-to-smolt survival based on fall-run at Tehama Colusa Spawning Channel (Hallock updated)" | NA | NA | NA |
| 2018 | 0.59 | Fry-to-smolt survival | Natural | 2019-02-01 | "7/ Estimate of fry-to-smolt survival based on fall-run at Tehama Colusa Spawning Channel (Hallock updated)" | NA | NA | NA |
| 2019 | 0.4651 | Fry-to-smolt survival | Natural | 2020-01-23 | "7/ Estimate of fry-to-smolt survival rate based on O’Farrell et al. (2018)." | NA | NA | NA |
| 2020 | 0.4475 | Fry-to-smolt survival | Natural | 2021-01-15 | "7/ Estimate of fry-to-smolt survival rate based on O’Farrell et al. (2018) applied to catch at RBDD." | Method 2 (O’Farrell et al 2018) with data from USFWS, UC Santa Cruz, and SWFSC | NA | NA |
| 2021 | 0.4429 | Fry-to-smolt survival | Natural | 2022-01-14 | "7/ Estimate of fry-to-smolt survival rate based on O’Farrell et al. (2018), updated using data from BY 1998-2016." | Method 2 (O’Farrell et al 2018) with data from USFWS, UC Santa Cruz, and SWFSC | NA | NA |
| 2022 | 0.4946 | Fry-to-smolt survival | Natural | 2023-01-13 | "7/ Estimate of fry-to-smolt survival rate based on O’Farrell et al. (2018), updated using data from BY 1998-2017." | Method 2 (O’Farrell et al 2018) with data from USFWS, UC Santa Cruz, and SWFSC | NA | NA |
| 2023 | 0.5066 | Fry-to-smolt survival | Natural | 2024-01-12 | "7/ Estimate of fry-to-smolt survival rate based on O'Farrell et al. (2018), updated using data from BY 1998-2017." | Method 2 (O'Farrell et al 2018) with data from USFWS, UC Santa Cruz, and SWFSC | NA | NA |
| 2024 | 0.5149 | Fry-to-smolt survival | Natural | 2025-01-10 | "7/ Estimate of fry-to-smolt survival rate based on O'Farrell et al. (2018), updated using data from BY 1998-2017." | Method 2 (O'Farrell et al 2018) with data from USFWS, UC Santa Cruz, and SWFSC | NA | NA |
| 2025 | 0.5217 | Fry-to-smolt survival | Natural | 2026-01-08 | "7/ Estimate of fry-to-smolt survival rate based on O’Farrell et al. (2018), updated using data from BY 1998-2020." | Method 2 (O'Farrell et al 2018) with data from USFWS, UC Santa Cruz, and SWFSC | NA | NA |
| *From Table 1 of "Final Winter-Run Juvenile Production Estimate Recommendation for Brood Year" letters from CDFW / Winter-run PWT to NMFS (Enclosures in JPE letters) | ||||||||
Natural Origin: Estimated smolt survival term
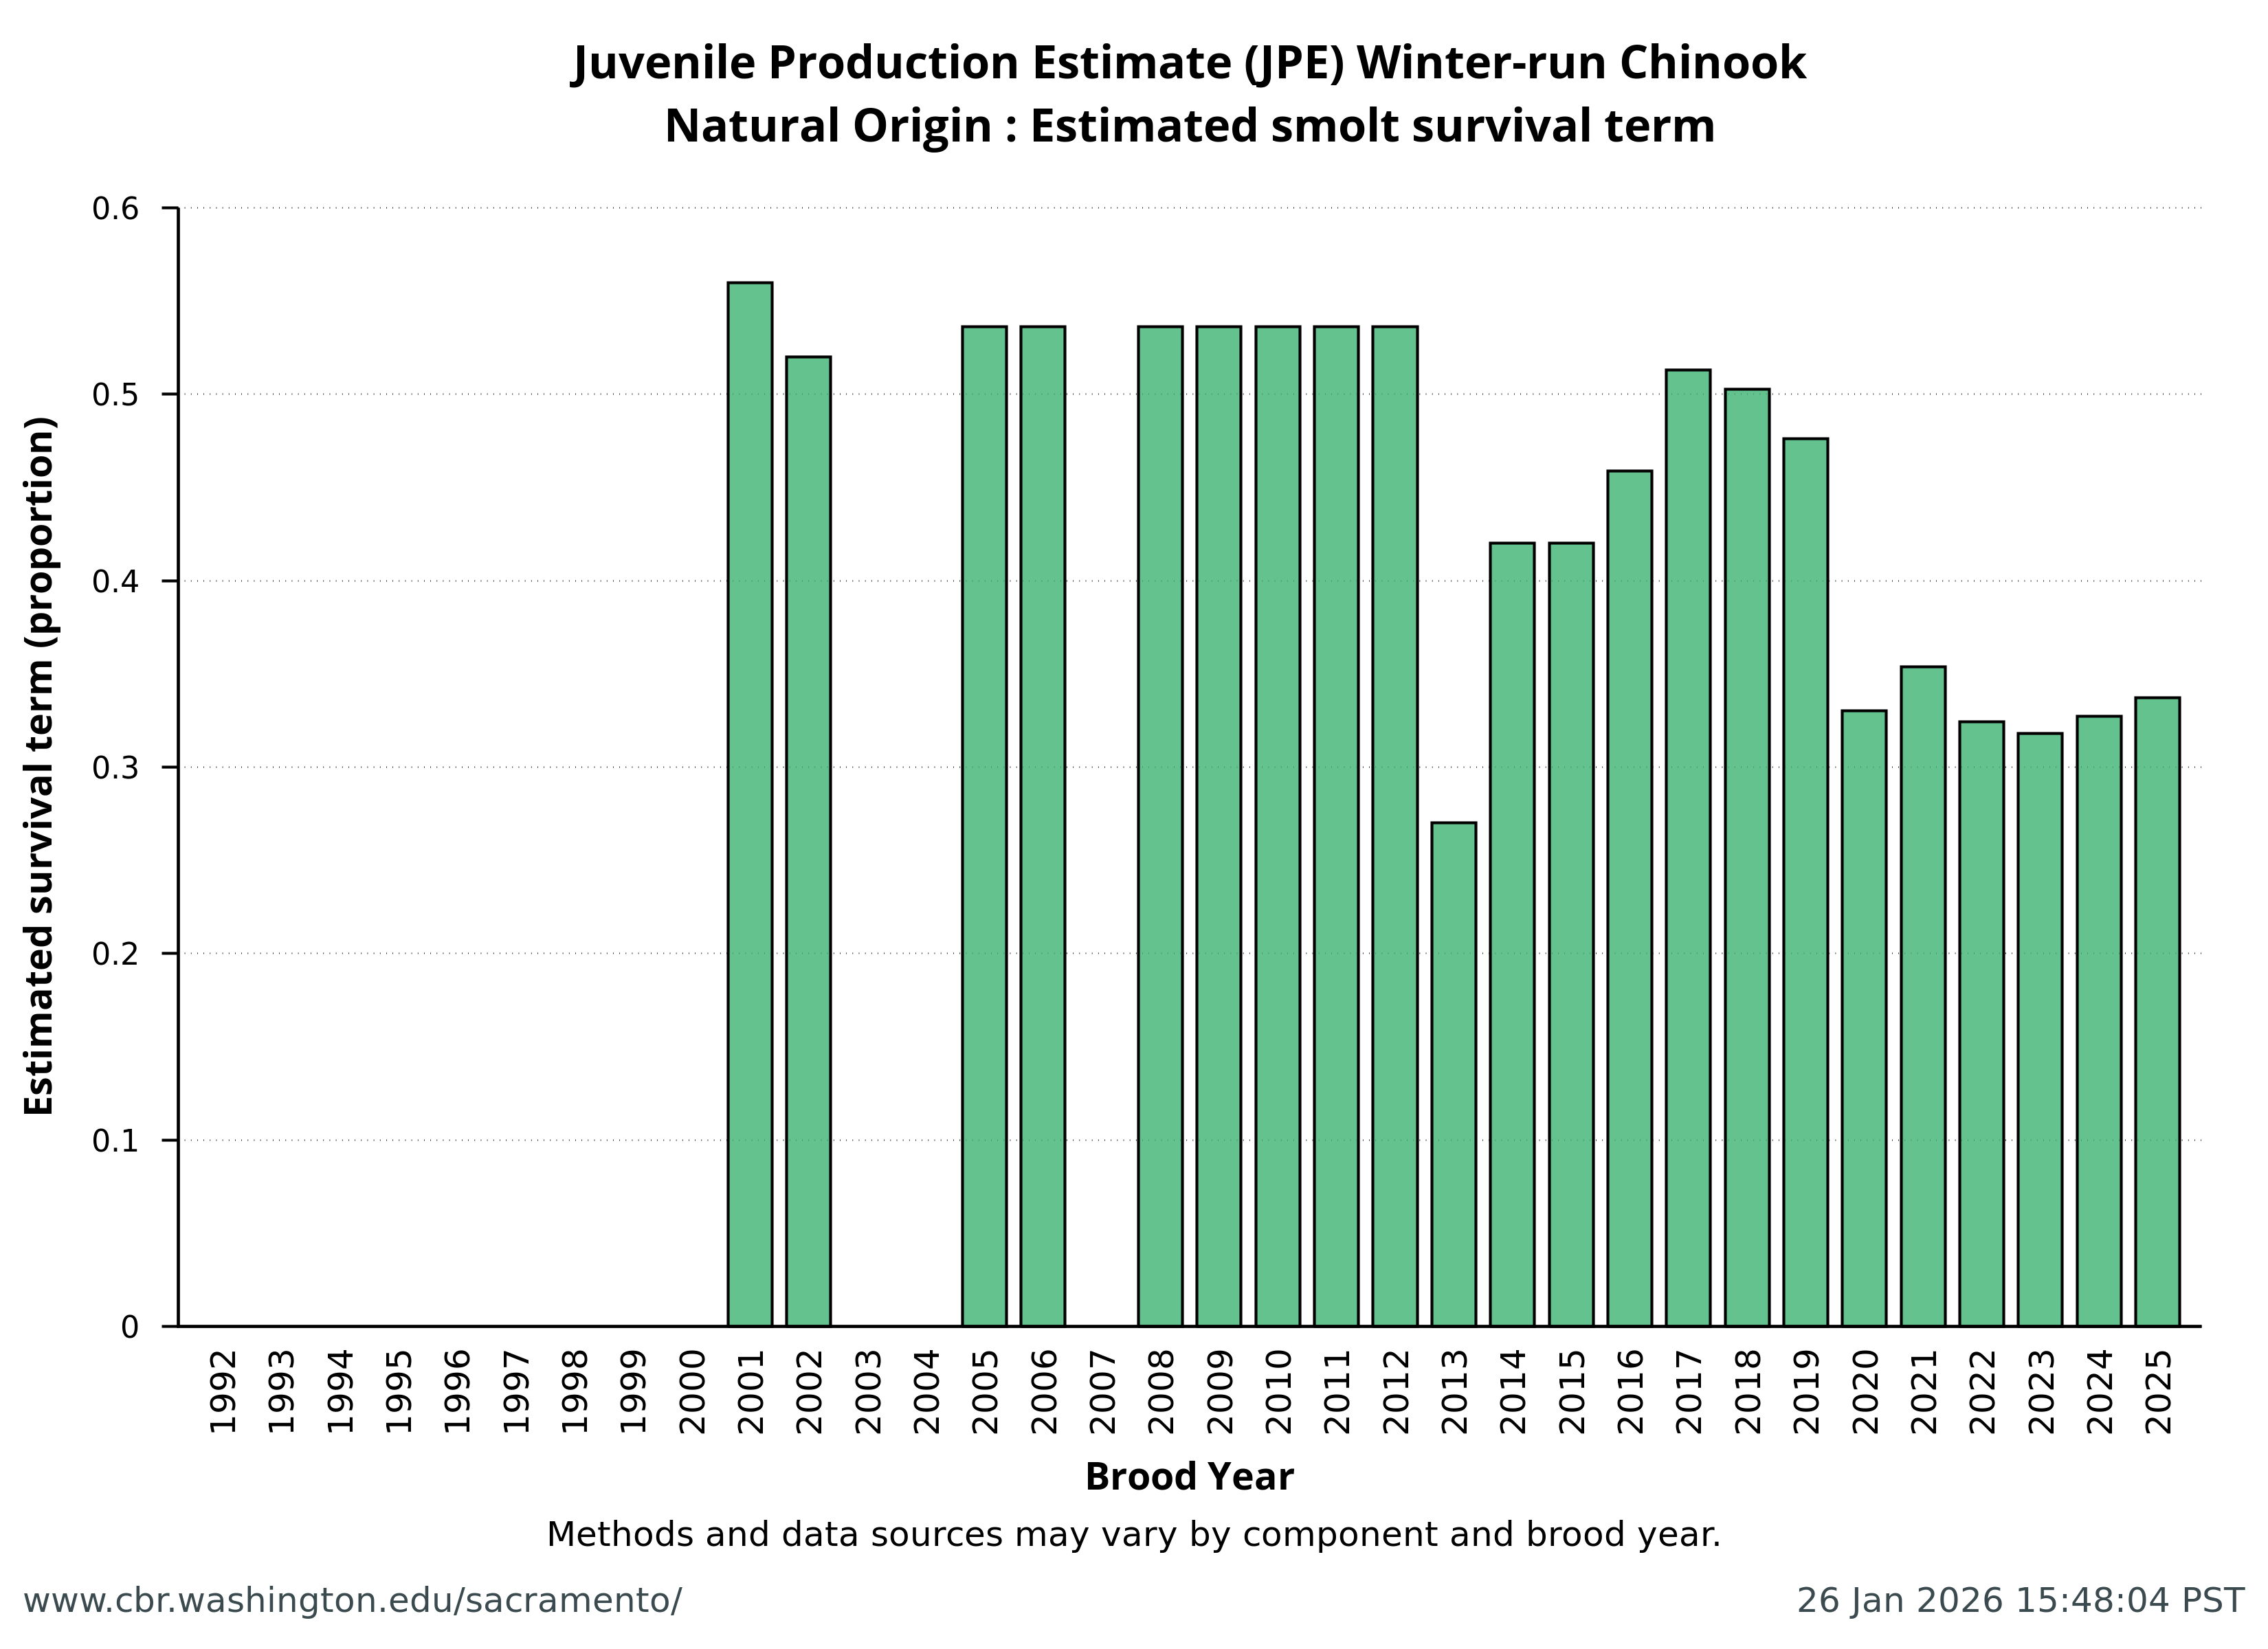

| Brood Year | Value | Component | Origin | JPE letter date | Footnote* | References & Contributors | Lower 95% CI | Upper 95% CI |
|---|---|---|---|---|---|---|---|---|
| 1992 | NA | Estimated smolt survival term | Natural | NA | NA | NA | NA | NA |
| 1993 | NA | Estimated smolt survival term | Natural | NA | NA | NA | NA | NA |
| 1994 | NA | Estimated smolt survival term | Natural | NA | NA | NA | NA | NA |
| 1995 | NA | Estimated smolt survival term | Natural | NA | NA | NA | NA | NA |
| 1996 | NA | Estimated smolt survival term | Natural | NA | NA | NA | NA | NA |
| 1997 | NA | Estimated smolt survival term | Natural | NA | NA | NA | NA | NA |
| 1998 | NA | Estimated smolt survival term | Natural | NA | NA | NA | NA | NA |
| 1999 | NA | Estimated smolt survival term | Natural | NA | NA | NA | NA | NA |
| 2000 | NA | Estimated smolt survival term | Natural | NA | NA | NA | NA | NA |
| 2001 | 0.56 | Estimated smolt survival term | Natural | 2002-02-22 | "7/ Based on ocean recoveries of paired CWT releases from Battle Cr, 1994-1999 (FWS 2002, unpublished)" | NA | NA | NA |
| 2002 | 0.52 | Estimated smolt survival term | Natural | 2003-02-19 | "7/ Average of ocean recoveries of paired Late-Fall Chinook from Coleman National Fish Hatchery released at Battle Cr. and Delta locations from 1994-99 (USFWS 2003, unpubl.)" | NA | NA | NA |
| 2003 | NA | Estimated smolt survival term | Natural | NA | NA | NA | NA | NA |
| 2004 | NA | Estimated smolt survival term | Natural | NA | NA | NA | NA | NA |
| 2005 | 0.53625 | Estimated smolt survival term | Natural | 2006-02-10 | "7/ Average of ocean recoveries of paired Late-Fall Chinook from Coleman National Fish Hatchery released at Battle Cr. and Delta locations from 1994-2001 (USFWS, unpubl. data, Chippstable 2005)" | NA | NA | NA |
| 2006 | 0.53625 | Estimated smolt survival term | Natural | 2007-02-15 | "7/ Average of ocean recoveries of paired Late-Fall Chinook fmm Coleman Hatchery released at Battle Cr. and Delta locations from 1994-2001 (USFWS, unpubl. data, Chippstable 2005)" | NA | NA | NA |
| 2007 | NA | Estimated smolt survival term | Natural | NA | NA | NA | NA | NA |
| 2008 | 0.53625 | Estimated smolt survival term | Natural | 2009-01-12 | "7/ Average of ocean recoveries paired Late-Fall from Coleman Hatchery released at Battle Creek and in Delta locations from 1994-2001 (USFWS, unpubl. data, Chippstable 2005)" | NA | NA | NA |
| 2009 | 0.53625 | Estimated smolt survival term | Natural | 2010-02-24 | "7/ Average of ocean recoveries paired Late-Fall from Coleman Hatchery released at Battle Creek and in Delta locations from 1994-2001 (USFWS, unpubl. data, Chippstable 2005)" | NA | NA | NA |
| 2010 | 0.53625 | Estimated smolt survival term | Natural | 2011-01-12 | "7/ Average of ocean recoveries paired Late-Fall from Coleman NFH released at Battle Cr.and Delta locations from 1994-2001 (USFWS, unpubl. data, Chippstable 2005)" | NA | NA | NA |
| 2011 | 0.53625 | Estimated smolt survival term | Natural | 2012-01-26 | "8/ Average of ocean recoveries of paired Late-Fall releases from Coleman NFH released at Battle Cr.and Delta locations from 1994-2001 (USFWS, unpubl. data, Chipps Table 2005)" | NA | NA | NA |
| 2012 | 0.53625 | Estimated smolt survival term | Natural | 2013-01-31 | "8/ Average of ocean recoveries of paired Late-Fall releases from Coleman NFH released at Battle Creek and Delta locations from 1994-2001 (USFWS, unpubl. data, Chipps Table 2005)" | NA | NA | NA |
| 2013 | 0.27 | Estimated smolt survival term | Natural | 2014-02-21 | "10/ Survival of acoustically tagged winter run in 2014 between Salt Creek and Tower Bridge - A. Ammann, personal communication" | NA | NA | NA |
| 2014 | 0.42 | Estimated smolt survival term | Natural | 2015-01-16 | "10/ Survival of acoustically tagged winter run in 2014 between Salt Creek and Tower Bridge - A. Ammann, personal communication" | NA | NA | NA |
| 2015 | 0.42 | Estimated smolt survival term | Natural | 2016-01-28 | "10/ Average survival of acoustically tagged winter run in 2013, 2014 and 2015 (2 values in 2015) between RBDD and 180 Tower Bridge in Sacramento - A. Ammann, NMFS, personal communication. Survival is estimated from the Salt Creek receiver site, located 3 miles downstream of RBDD, to estimate survival from RBDD for acoustic tag studies." | NA | NA | NA |
| 2016 | 0.459 | Estimated smolt survival term | Natural | 2017-02-03 | "9/ Average weighted survival of acoustically tagged winter-run in 2013, 2014 and 2015 (2 values in 2015) between RBDD and 180 Tower Bridge in Sacramento - A. Ammann, NMFS, personal communication. Survival is estimated from the Sall Creek receiver site, located 3 miles downstream of RBDD, to estimate survival from RBDD for acoustic tag studies." | NA | NA | NA |
| 2017 | 0.5129 | Estimated smolt survival term | Natural | 2018-01-08 | "7/ Average weighted survival of acoustically tagged winter-run in 2013, 2014, 2015 (2 values in 2015) and 2016 (2 values in 2016) and one value in 2017 between RBDD and 180 Tower Bridge in Sacramento - A. Ammann, NMFS, personal communication. Survival is estimated from the Salt Creek receiver site, located 3 miles downstream of RBDD, to estimate survival from RBDD for acoustic tag studies (See Appendix A, for further description of how the weighted average acoustic tag survival was used for methods 2, 2a,3 and 3a). This is the derivation of the numbers of fish arriving to Salt Ck (RBDD) and Sacramento (Tower, Sac180/50) from the acoustic tagged LSNFH winter run pre-smolts. The number of fish arriving to Salt Ck and Sac 180/50 are derived by looking at receivers at this location and all locations downstream. It uses fish directly detected at that site plus any fish that were missed at that site but detected at a site downstream. This was done for all years 2013-2017. The 2017 year was the only year that had significant flows over Fremont Weir. Fish that went over the weir and into the Yolo Bypass would bypass the Sacramento 180/50 Bridge and other nearby receiver locations. If these fish were detected at locations downstream of Liberty Island they were considered to have survived to the Delta and thus added to the number of the fish counted at Sacramento 180/50 Bridge." | NA | NA | NA |
| 2018 | 0.5028 | Estimated smolt survival term | Natural | 2019-02-01 | "8/ Average weighted survival of acoustically tagged winter-run in 2013,2014,2015 (2 values), 2016 (2 values), 2017, and 2018 between RBDD and 180 Tower Bridge in Sacramento. Survival is estimated from the Salt Creek receiver site, located 3 miles downstream of RBDD, to estimate survival from RBDD for acoustic tag studies (M. O'Farrell, NMFS, personal communication)" | NA | NA | NA |
| 2019 | 0.4762 | Estimated smolt survival term | Natural | 2020-01-23 | "8/ Variance-weighted mean survival rate of acoustically tagged winter-run from 2013 to 2019 between RBDD and I-80/Tower Bridge in Sacramento. Survival is estimated from the Salt Creek receiver site, located 3 miles downstream of RBDD, to estimate survival from RBDD for acoustic tag studies. See Smolt Survival section for an explanation of the different values displayed here." | Southwest Fisheries Science Center, NMFS, NOAA; and University of California Santa Cruz. | NA | NA |
| 2020 | 0.3304 | Estimated smolt survival term | Natural | 2021-01-15 | "8/ Variance-weighted mean survival rate of acoustically tagged hatchery winter-run from 2013 to 2020 between RBDD and I-80/Tower Bridge in Sacramento. Survival is estimated from the Salt Creek receiver site, located 3 miles downstream of RBDD, to estimate survival from RBDD for natural-origin smolts." | Method 2 (O’Farrell et al 2018) with data from USFWS, UC Santa Cruz, and SWFSC | NA | NA |
| 2021 | 0.3537 | Estimated smolt survival term | Natural | 2022-01-14 | "8/ Variance-weighted mean survival rate of acoustically tagged hatchery winter-run Chinook Salmon from 2013 to 2021 between RBDD and I-80/Tower Bridge in Sacramento (based on O’Farrell et al. 2018). Survival is estimated from the Salt Creek receiver site, located 3 miles downstream of RBDD, to estimate survival from RBDD for natural-origin smolts." | Method 2 (O’Farrell et al 2018) with data from USFWS, UC Santa Cruz, and SWFSC | NA | NA |
| 2022 | 0.3245 | Estimated smolt survival term | Natural | 2023-01-13 | "8/ Variance-weighted mean survival rate of acoustically tagged hatchery winter-run Chinook Salmon from 2013 to 2022 between RBDD and I-80/Tower Bridge in Sacramento (based on O’Farrell et al. 2018). Survival is estimated from the Salt Creek receiver site, located 3 miles downstream of RBDD, to estimate survival from RBDD for natural-origin smolts." | Method 2 (O’Farrell et al 2018) with data from USFWS, UC Santa Cruz, and SWFSC | NA | NA |
| 2023 | 0.318 | Estimated smolt survival term | Natural | 2024-01-12 | "8/ Variance-weighted mean survival rate of acoustically tagged hatchery winter-run Chinook Salmon from 2013 to 2023 between RBDD and at or below I-80/Tower Bridge in Sacramento (based on O’Farrell et al. 2018). Survival is estimated from the Salt Creek receiver site, located 3 miles downstream of RBDD, to estimate survival from RBDD for natural-origin smolts." | Method 2 (O'Farrell et al 2018) with data from USFWS, UC Santa Cruz, and SWFSC | NA | NA |
| 2024 | 0.3271 | Estimated smolt survival term | Natural | 2025-01-10 | "8/ Variance-weighted mean survival rate of acoustically tagged hatchery winter-run Chinook Salmon from 2013 to 2024 between RBDD and at or below I-80/Tower Bridge in Sacramento (based on O’Farrell et al. 2018). Survival is estimated from the Salt Creek receiver site, located 3 miles downstream of RBDD, to estimate survival from RBDD for natural-origin smolts." | Method 2 (O'Farrell et al 2018) with data from USFWS, UC Santa Cruz, and SWFSC | NA | NA |
| 2025 | 0.3374 | Estimated smolt survival term | Natural | 2026-01-08 | "8/ Variance-weighted mean survival rate of acoustically tagged hatchery winter-run Chinook Salmon from 2013 to 2025 between RBDD and at or below I-80/Tower Bridge in Sacramento (based on O’Farrell et al. 2018). Survival is estimated from the Salt Creek receiver site, located 3 miles downstream of RBDD, to estimate survival from RBDD for natural-origin smolts." | Method 2 (O'Farrell et al 2018) with data from USFWS, UC Santa Cruz, and SWFSC | NA | NA |
| *From Table 1 of "Final Winter-Run Juvenile Production Estimate Recommendation for Brood Year" letters from CDFW / Winter-run PWT to NMFS (Enclosures in JPE letters) | ||||||||
Natural Origin: Number of smolts at RBDD
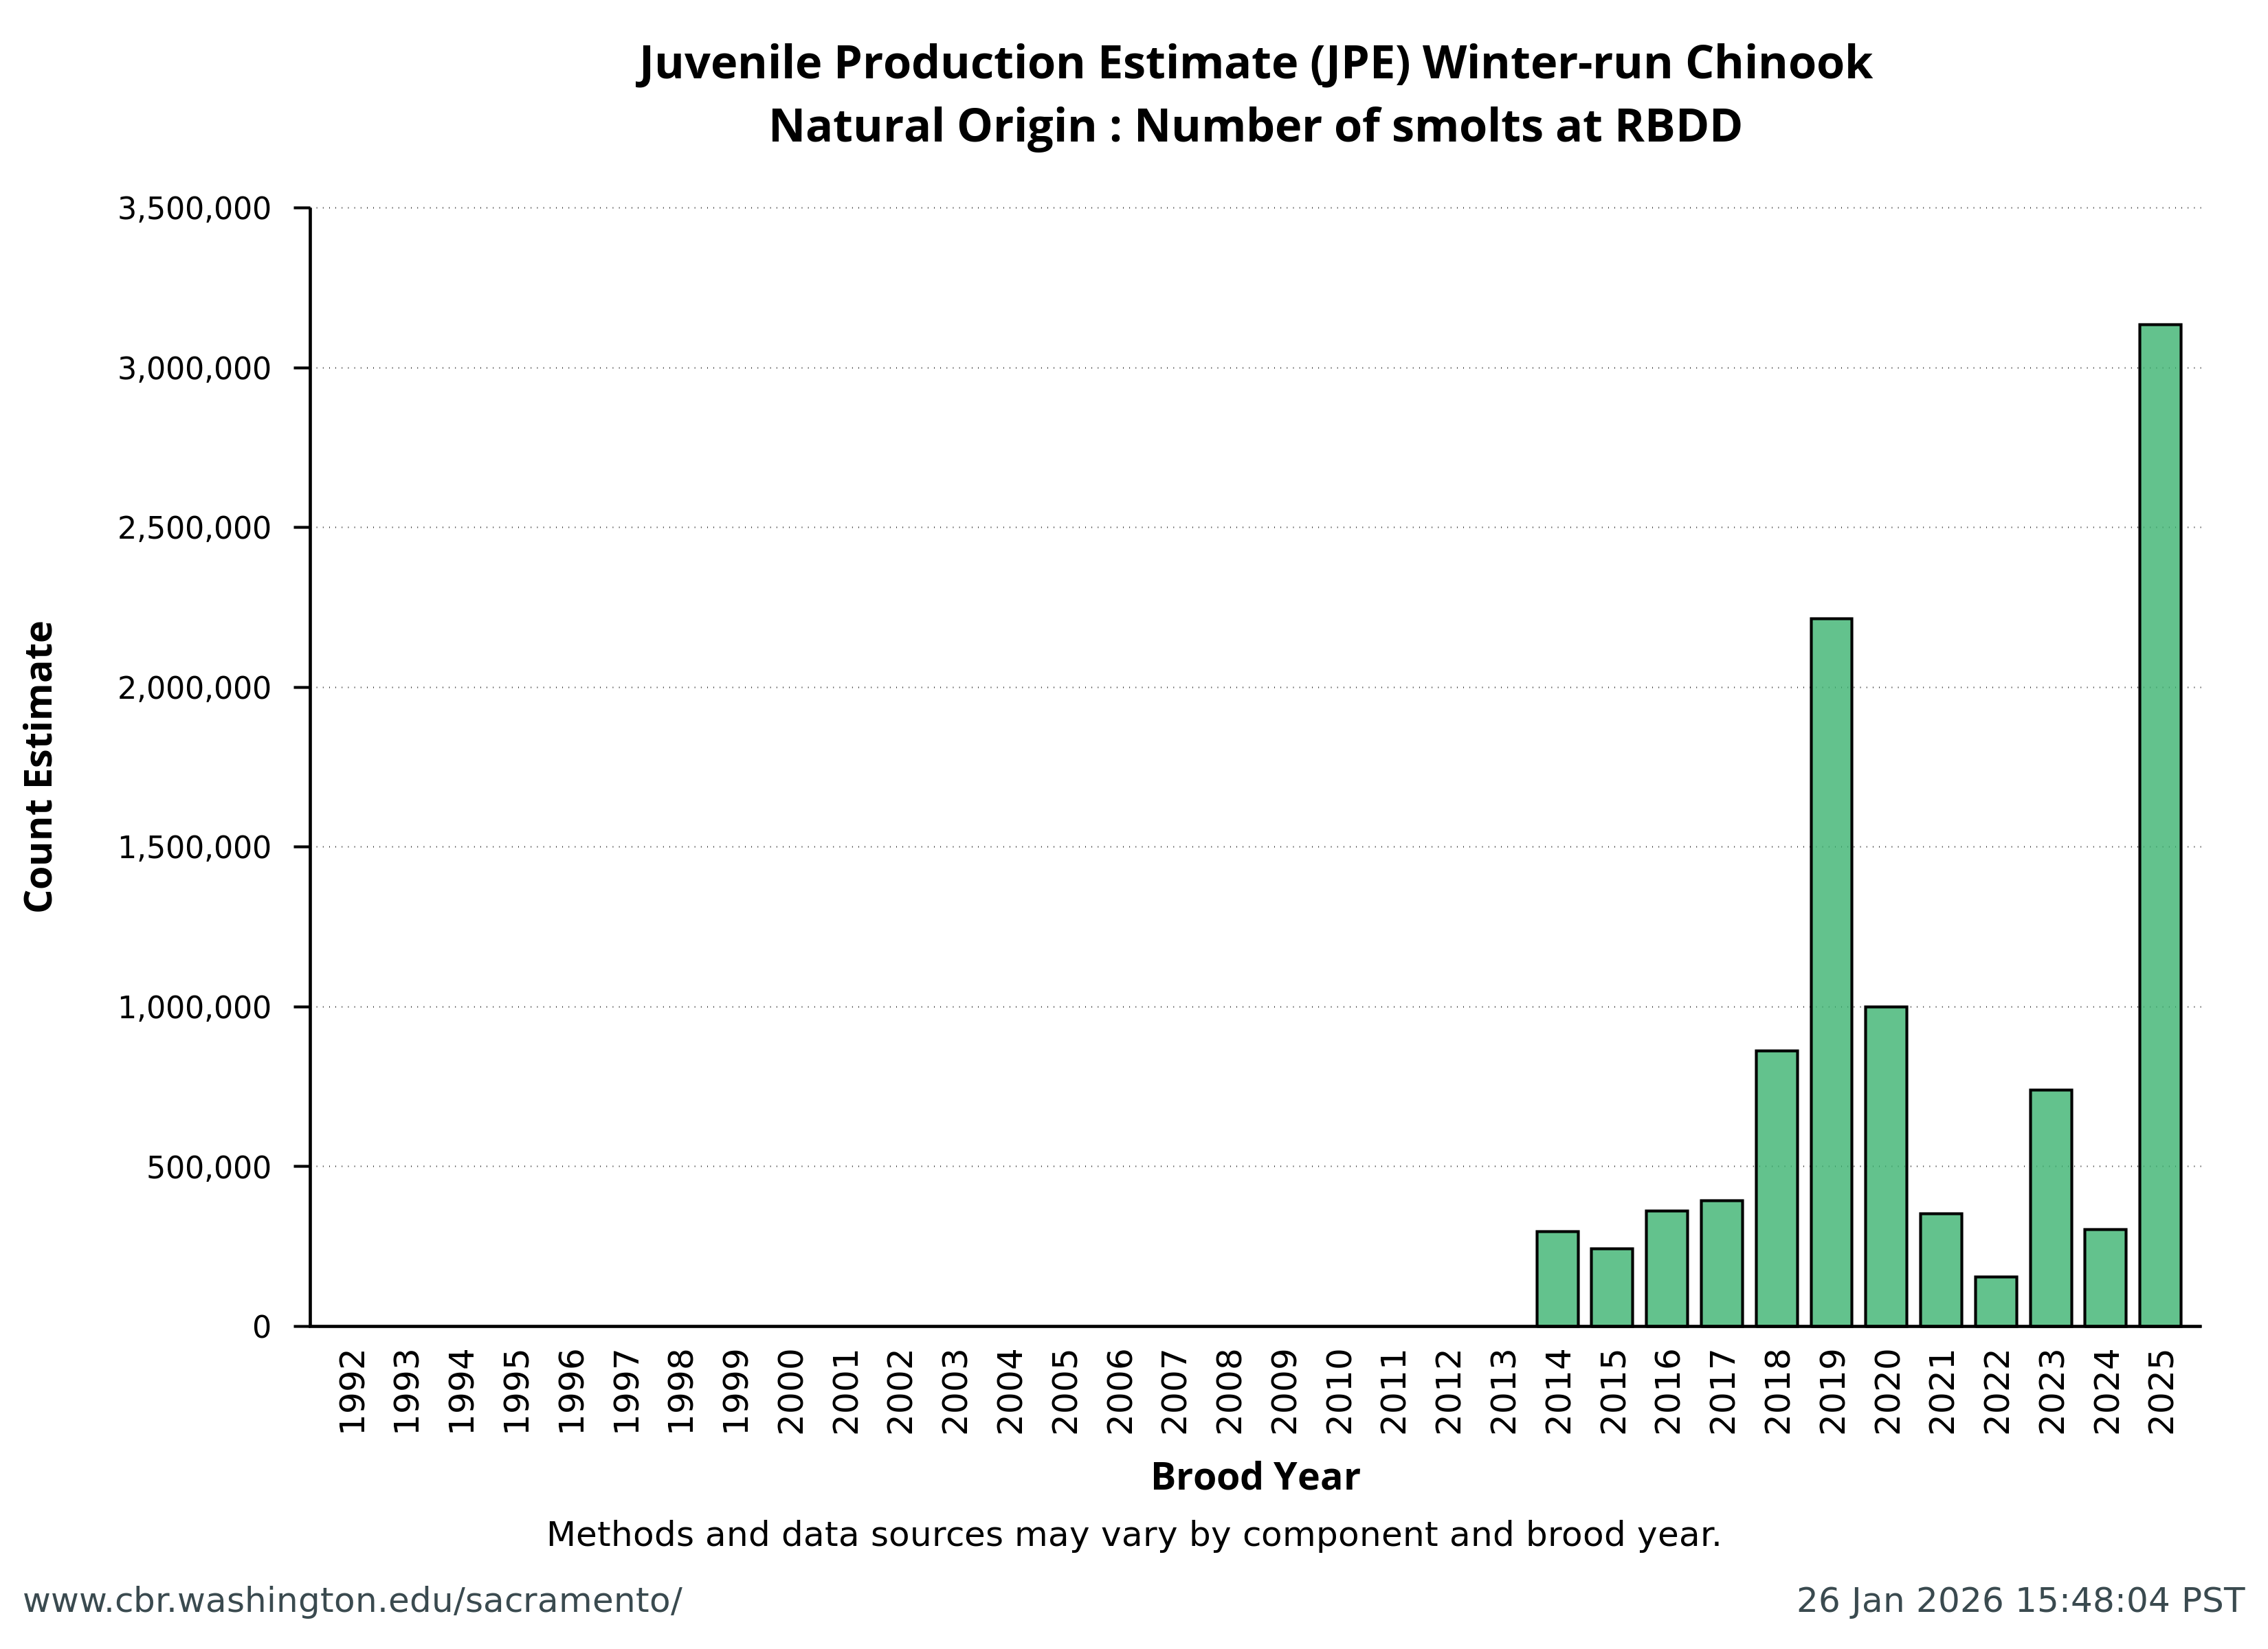

| Brood Year | Value | Component | Origin | JPE letter date | Footnote | References & Contributors | Lower 95% CI | Upper 95% CI |
|---|---|---|---|---|---|---|---|---|
| 1992 | NA | Number of smolts at RBDD | Natural | NA | NA | NA | NA | NA |
| 1993 | NA | Number of smolts at RBDD | Natural | NA | NA | NA | NA | NA |
| 1994 | NA | Number of smolts at RBDD | Natural | NA | NA | NA | NA | NA |
| 1995 | NA | Number of smolts at RBDD | Natural | NA | NA | NA | NA | NA |
| 1996 | NA | Number of smolts at RBDD | Natural | NA | NA | NA | NA | NA |
| 1997 | NA | Number of smolts at RBDD | Natural | NA | NA | NA | NA | NA |
| 1998 | NA | Number of smolts at RBDD | Natural | NA | NA | NA | NA | NA |
| 1999 | NA | Number of smolts at RBDD | Natural | NA | NA | NA | NA | NA |
| 2000 | NA | Number of smolts at RBDD | Natural | NA | NA | NA | NA | NA |
| 2001 | NA | Number of smolts at RBDD | Natural | NA | NA | NA | NA | NA |
| 2002 | NA | Number of smolts at RBDD | Natural | NA | NA | NA | NA | NA |
| 2003 | NA | Number of smolts at RBDD | Natural | NA | NA | NA | NA | NA |
| 2004 | NA | Number of smolts at RBDD | Natural | NA | NA | NA | NA | NA |
| 2005 | NA | Number of smolts at RBDD | Natural | NA | NA | NA | NA | NA |
| 2006 | NA | Number of smolts at RBDD | Natural | NA | NA | NA | NA | NA |
| 2007 | NA | Number of smolts at RBDD | Natural | NA | NA | NA | NA | NA |
| 2008 | NA | Number of smolts at RBDD | Natural | NA | NA | NA | NA | NA |
| 2009 | NA | Number of smolts at RBDD | Natural | NA | NA | NA | NA | NA |
| 2010 | NA | Number of smolts at RBDD | Natural | NA | NA | NA | NA | NA |
| 2011 | NA | Number of smolts at RBDD | Natural | NA | NA | NA | NA | NA |
| 2012 | NA | Number of smolts at RBDD | Natural | NA | NA | NA | NA | NA |
| 2013 | NA | Number of smolts at RBDD | Natural | NA | NA | NA | NA | NA |
| 2014 | 296,479 | Number of smolts at RBDD | Natural | 2015-01-16 | NA | USFWS | NA | NA |
| 2015 | 242,180 | Number of smolts at RBDD | Natural | 2016-01-28 | NA | USFWS | NA | NA |
| 2016 | 362,068 | Number of smolts at RBDD | Natural | 2017-02-03 | NA | USFWS | NA | NA |
| 2017 | 392,688 | Number of smolts at RBDD | Natural | 2018-01-08 | NA | USFWS | NA | NA |
| 2018 | 861,527 | Number of smolts at RBDD | Natural | 2019-02-01 | NA | USFWS | NA | NA |
| 2019 | 2,214,872 | Number of smolts at RBDD | Natural | 2020-01-23 | NA | USFWS | NA | NA |
| 2020 | 999,183 | Number of smolts at RBDD | Natural | 2021-01-15 | NA | USFWS | NA | NA |
| 2021 | 353,515 | Number of smolts at RBDD | Natural | 2022-01-14 | NA | USFWS | NA | NA |
| 2022 | 153,849 | Number of smolts at RBDD | Natural | 2023-01-13 | NA | USFWS | NA | NA |
| 2023 | 738,668 | Number of smolts at RBDD | Natural | 2024-01-12 | NA | USFWS | NA | NA |
| 2024 | 302,332 | Number of smolts at RBDD | Natural | 2025-01-10 | NA | USFWS | NA | NA |
| 2025 | 3,134,121 | Number of smolts at RBDD | Natural | 2026-01-08 | NA | USFWS | NA | NA |
Natural Origin: Fry equivalents of juvenile production at RBDD
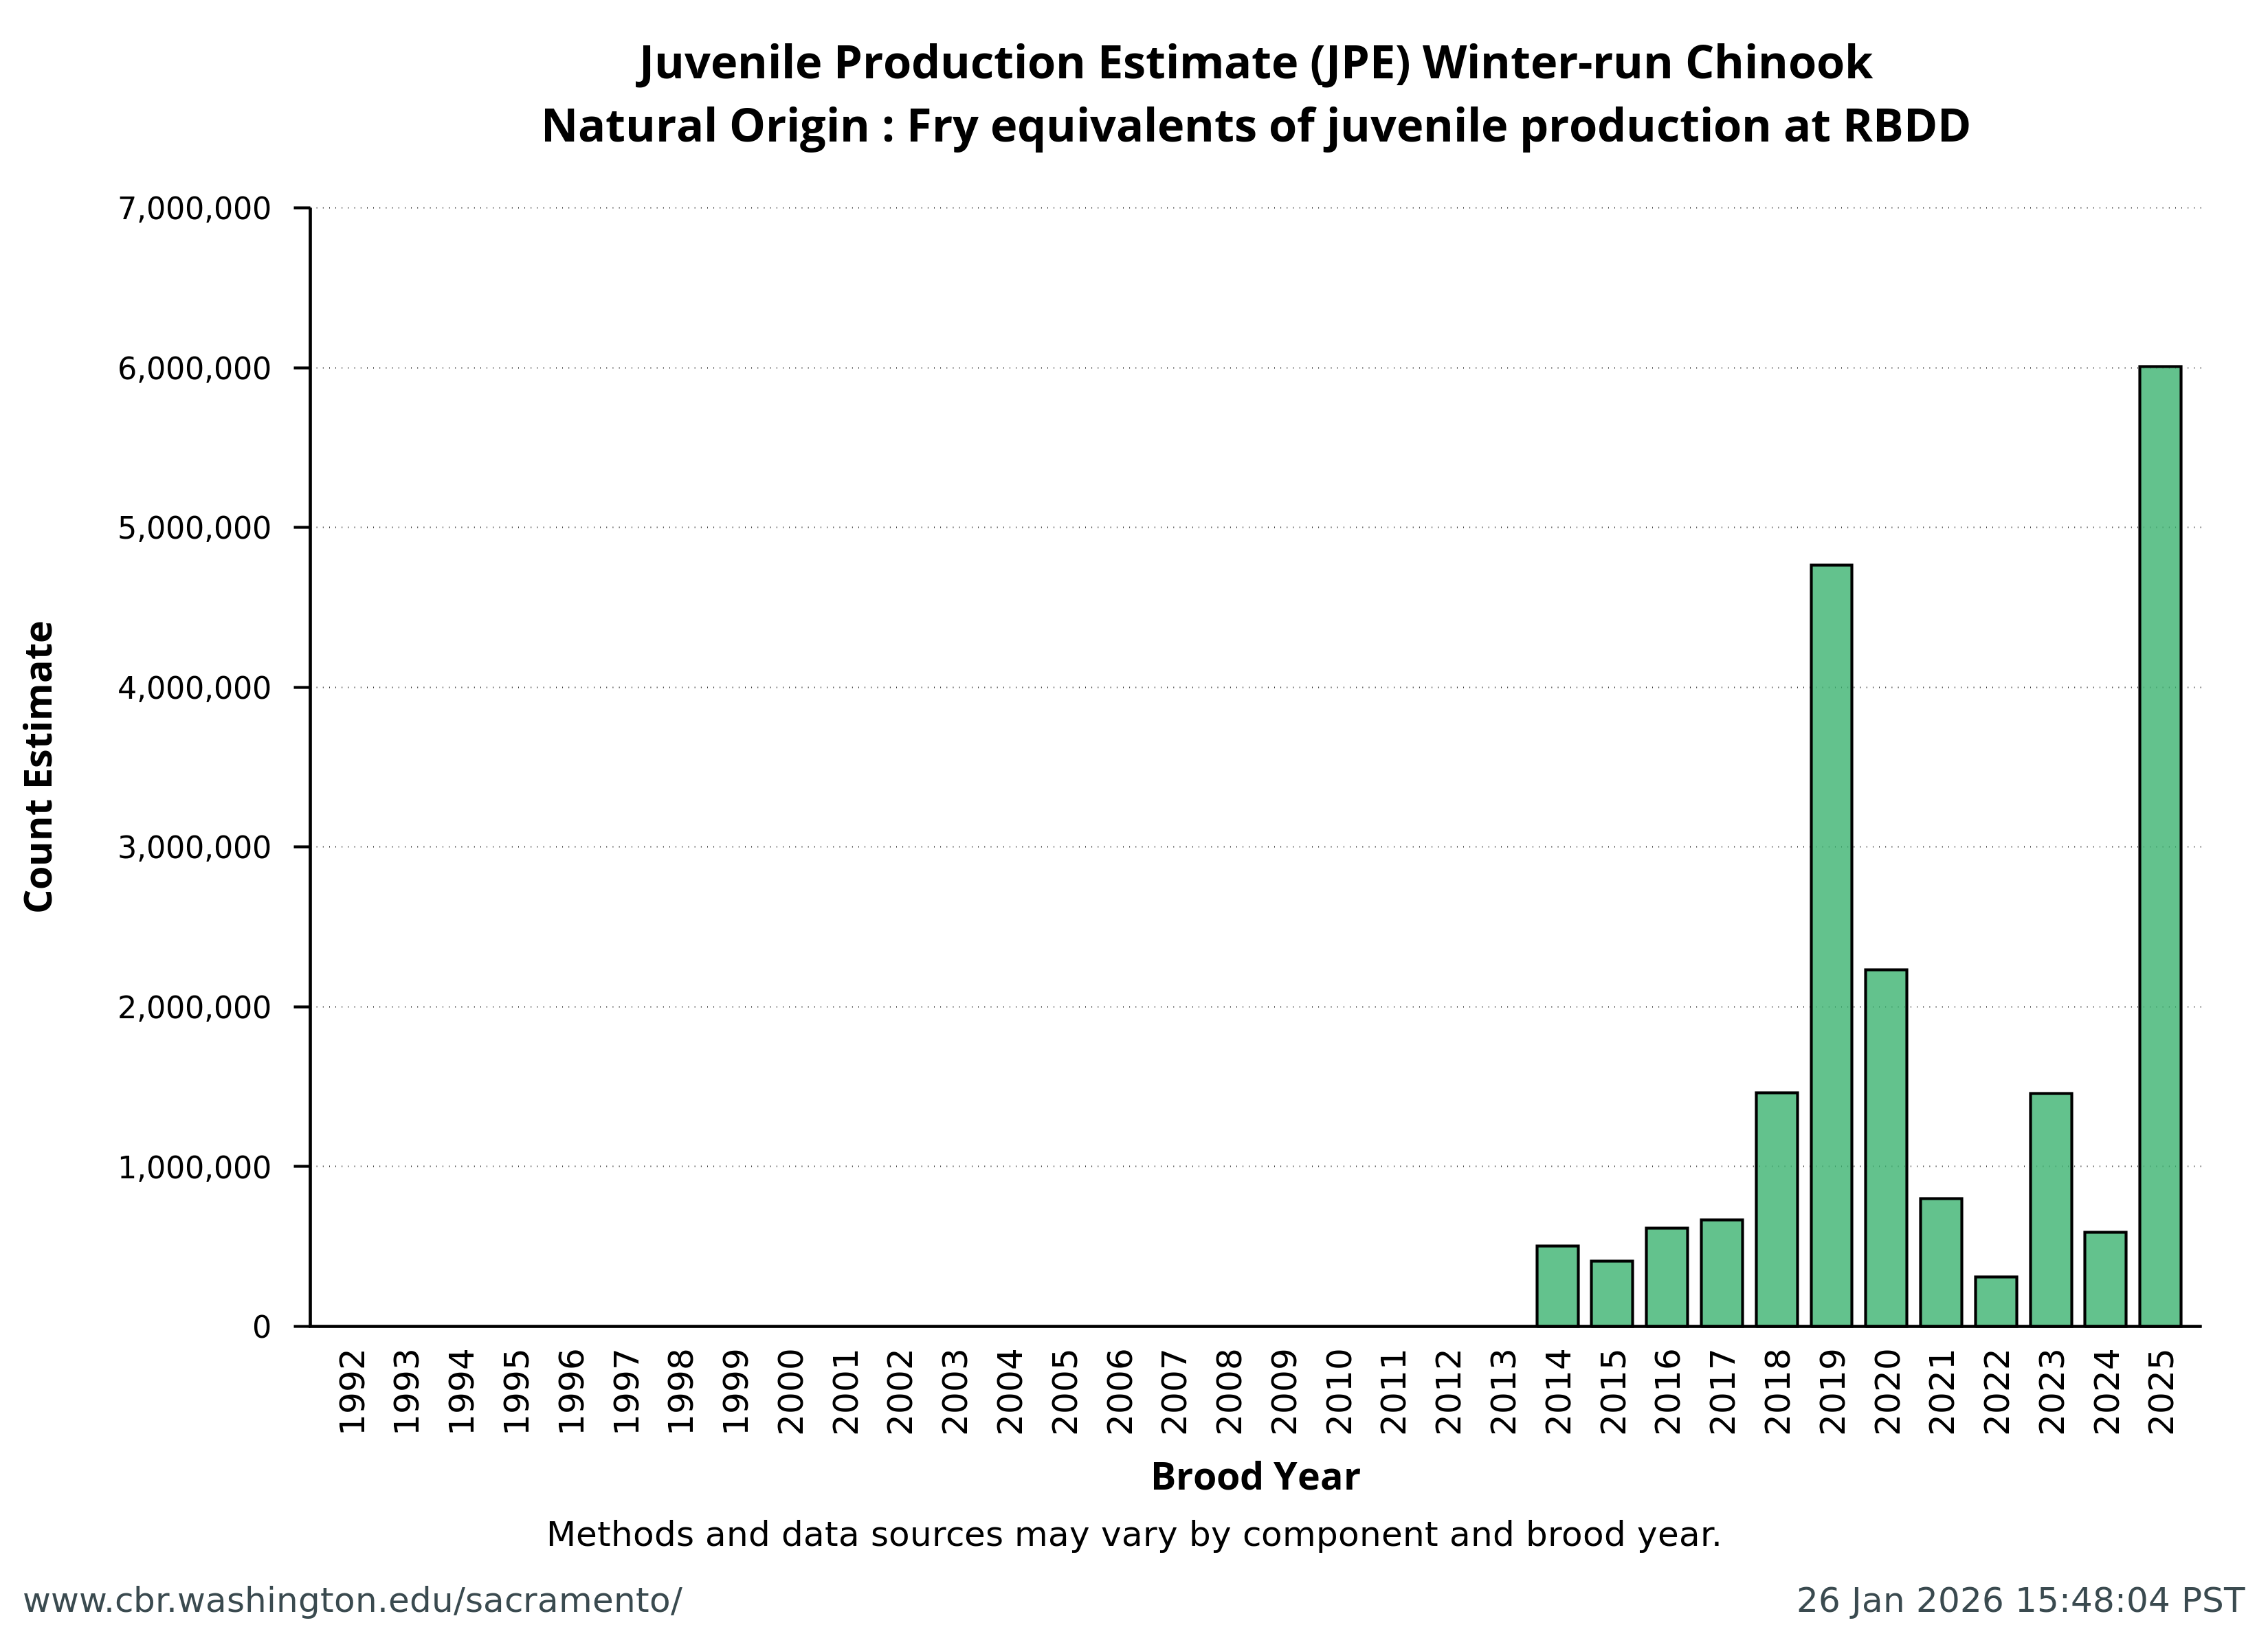

| Brood Year | Value | Component | Origin | JPE letter date | Footnote* | References & Contributors | Lower 95% CI | Upper 95% CI |
|---|---|---|---|---|---|---|---|---|
| 1992 | NA | Fry equivalents of juvenile production at RBDD | Natural | NA | NA | NA | NA | NA |
| 1993 | NA | Fry equivalents of juvenile production at RBDD | Natural | NA | NA | NA | NA | NA |
| 1994 | NA | Fry equivalents of juvenile production at RBDD | Natural | NA | NA | NA | NA | NA |
| 1995 | NA | Fry equivalents of juvenile production at RBDD | Natural | NA | NA | NA | NA | NA |
| 1996 | NA | Fry equivalents of juvenile production at RBDD | Natural | NA | NA | NA | NA | NA |
| 1997 | NA | Fry equivalents of juvenile production at RBDD | Natural | NA | NA | NA | NA | NA |
| 1998 | NA | Fry equivalents of juvenile production at RBDD | Natural | NA | NA | NA | NA | NA |
| 1999 | NA | Fry equivalents of juvenile production at RBDD | Natural | NA | NA | NA | NA | NA |
| 2000 | NA | Fry equivalents of juvenile production at RBDD | Natural | NA | NA | NA | NA | NA |
| 2001 | NA | Fry equivalents of juvenile production at RBDD | Natural | NA | NA | NA | NA | NA |
| 2002 | NA | Fry equivalents of juvenile production at RBDD | Natural | NA | NA | NA | NA | NA |
| 2003 | NA | Fry equivalents of juvenile production at RBDD | Natural | NA | NA | NA | NA | NA |
| 2004 | NA | Fry equivalents of juvenile production at RBDD | Natural | NA | NA | NA | NA | NA |
| 2005 | NA | Fry equivalents of juvenile production at RBDD | Natural | NA | NA | NA | NA | NA |
| 2006 | NA | Fry equivalents of juvenile production at RBDD | Natural | NA | NA | NA | NA | NA |
| 2007 | NA | Fry equivalents of juvenile production at RBDD | Natural | NA | NA | NA | NA | NA |
| 2008 | NA | Fry equivalents of juvenile production at RBDD | Natural | NA | NA | NA | NA | NA |
| 2009 | NA | Fry equivalents of juvenile production at RBDD | Natural | NA | NA | NA | NA | NA |
| 2010 | NA | Fry equivalents of juvenile production at RBDD | Natural | NA | NA | NA | NA | NA |
| 2011 | NA | Fry equivalents of juvenile production at RBDD | Natural | NA | NA | NA | NA | NA |
| 2012 | NA | Fry equivalents of juvenile production at RBDD | Natural | NA | NA | NA | NA | NA |
| 2013 | NA | Fry equivalents of juvenile production at RBDD | Natural | NA | NA | NA | NA | NA |
| 2014 | 502,506 | Fry equivalents of juvenile production at RBDD | Natural | 2015-01-16 | "8/ Number of fry equivalents at RBDD-JPI-Bill Poytress, personal communication" | USFWS | NA | NA |
| 2015 | 410,475 | Fry equivalents of juvenile production at RBDD | Natural | 2016-01-28 | "8/ Number of fry equivalents at RBDD - JPI - Bill Poytress, (USFWS), personal communication" | USFWS | NA | NA |
| 2016 | 613,675 | Fry equivalents of juvenile production at RBDD | Natural | 2017-02-03 | "7/ Number of fry equivalents estimated on December 16, 2016 at RBDD-JPI-Bill Poytress, (USFWS), personal communication" | USFWS | NA | NA |
| 2017 | 665,572 | Fry equivalents of juvenile production at RBDD | Natural | 2018-01-08 | "5/ Preliminary number of fry-equivalents estimated on December 16, 2017 plus 4.1% interpolation at RBDD - JPI - Bill Poytress,USFWS, personal communication" | USFWS | NA | NA |
| 2018 | 1,460,216 | Fry equivalents of juvenile production at RBDD | Natural | 2019-02-01 | "6/ Preliminary number of fry-equivalents estimated on January 14, 2019 plus 2.1% interpolation at RBDD using traditional (59%) fry to smolt survival estimates (Bill Poytress,USFWS, personal communication)" | USFWS | NA | NA |
| 2019 | 4,762,142 | Fry equivalents of juvenile production at RBDD | Natural | 2020-01-23 | "6/ Preliminary number of fry equivalents estimated on December 31, 2019 plus 3.1% interpolation to account for remainder of estimated passage for the 2019 brood year at RBDD; using 0.4651 fry-to-smolt survival rate estimate (Bill Poytress, USFWS, pers. comm.)." | Voss and Poytress (2022a), USFWS | NA | NA |
| 2020 | 2,232,811 | Fry equivalents of juvenile production at RBDD | Natural | 2021-01-15 | "6/ Preliminary number of fry equivalents estimated on January 14, 2021 plus 2.11% interpolation to account for remainder of estimated passage for the 2020 brood year at RBDD; using 0.4475 fry-to-smolt survival rate estimate (Bill Poytress, USFWS, pers. comm.). This estimate includes and does not differentiate between the number of fry equivalents outmigrating from Battle Creek and the Sacramento River." | Voss and Poytress (2022b), USFWS | NA | NA |
| 2021 | 798,183 | Fry equivalents of juvenile production at RBDD | Natural | 2022-01-14 | "6/ Preliminary number of fry equivalents estimated on December 31, 2021 plus 3.1% interpolation to account for remainder of estimated passage for the 2021 brood year at RBDD; using 0.4429 fry-to-smolt survival rate estimate (Bill Poytress, USFWS, pers. comm.). This estimate includes and does not differentiate between the number of fry equivalents outmigrating from Battle Creek and the Sacramento River." | Voss and Poytress (2023), USFWS | NA | NA |
| 2022 | 311,058 | Fry equivalents of juvenile production at RBDD | Natural | 2023-01-13 | "6/ Preliminary number of fry equivalents estimated on December 31, 2022 plus 2.70% interpolation to account for remainder of estimated passage for the 2022 brood year at RBDD; using 0.4946 fry-to-smolt survival rate estimate (Bill Poytress, USFWS, pers. comm.). This estimate includes and does not differentiate between the number of fry equivalents outmigrating from Battle Creek and the Sacramento River." | USFWS | NA | NA |
| 2023 | 1,458,089 | Fry equivalents of juvenile production at RBDD | Natural | 2024-01-12 | "6/ Preliminary number of fry equivalents estimated on December 31, 2023 plus 3.08% interpolation to account for remainder of estimated passage for the 2023 brood year at RBDD; using 0.5066 fry-to-smolt survival rate estimate (Bill Poytress, USFWS, pers. comm.). This estimate includes and does not differentiate the number of fry equivalents outmigrating from the McCloud River, Battle Creek, and the Sacramento River." | USFWS | NA | NA |
| 2024 | 587,167 | Fry equivalents of juvenile production at RBDD | Natural | 2025-01-10 | "6/ Preliminary number of fry equivalents estimated on December 31, 2024 plus 3.12% interpolation to account for remainder of estimated passage for the 2024 brood year at RBDD; using 0.5149 fry-to-smolt survival rate estimate (Bill Poytress, USFWS, pers. comm.). This estimate includes and does not differentiate the number of fry equivalents outmigrating from the McCloud River, Battle Creek, and the Sacramento River." | USFWS | NA | NA |
| 2025 | 6,007,515 | Fry equivalents of juvenile production at RBDD | Natural | 2026-01-08 | "6/ Preliminary number of fry equivalents estimated on December 31, 2025 plus 3.08% interpolation to account for remainder of estimated passage for the 2025 brood year at RBDD; using 0.5217 fry-to-smolt survival rate estimate (Bill Poytress, USFWS, pers. comm.). This estimate includes and does not differentiate the number of fry equivalents outmigrating from the McCloud River, Battle Creek, and the Sacramento River." | USFWS | NA | NA |
| *From Table 1 of "Final Winter-Run Juvenile Production Estimate Recommendation for Brood Year" letters from CDFW / Winter-run PWT to NMFS (Enclosures in JPE letters) | ||||||||
Natural Origin: Natural Incidental Take Limit
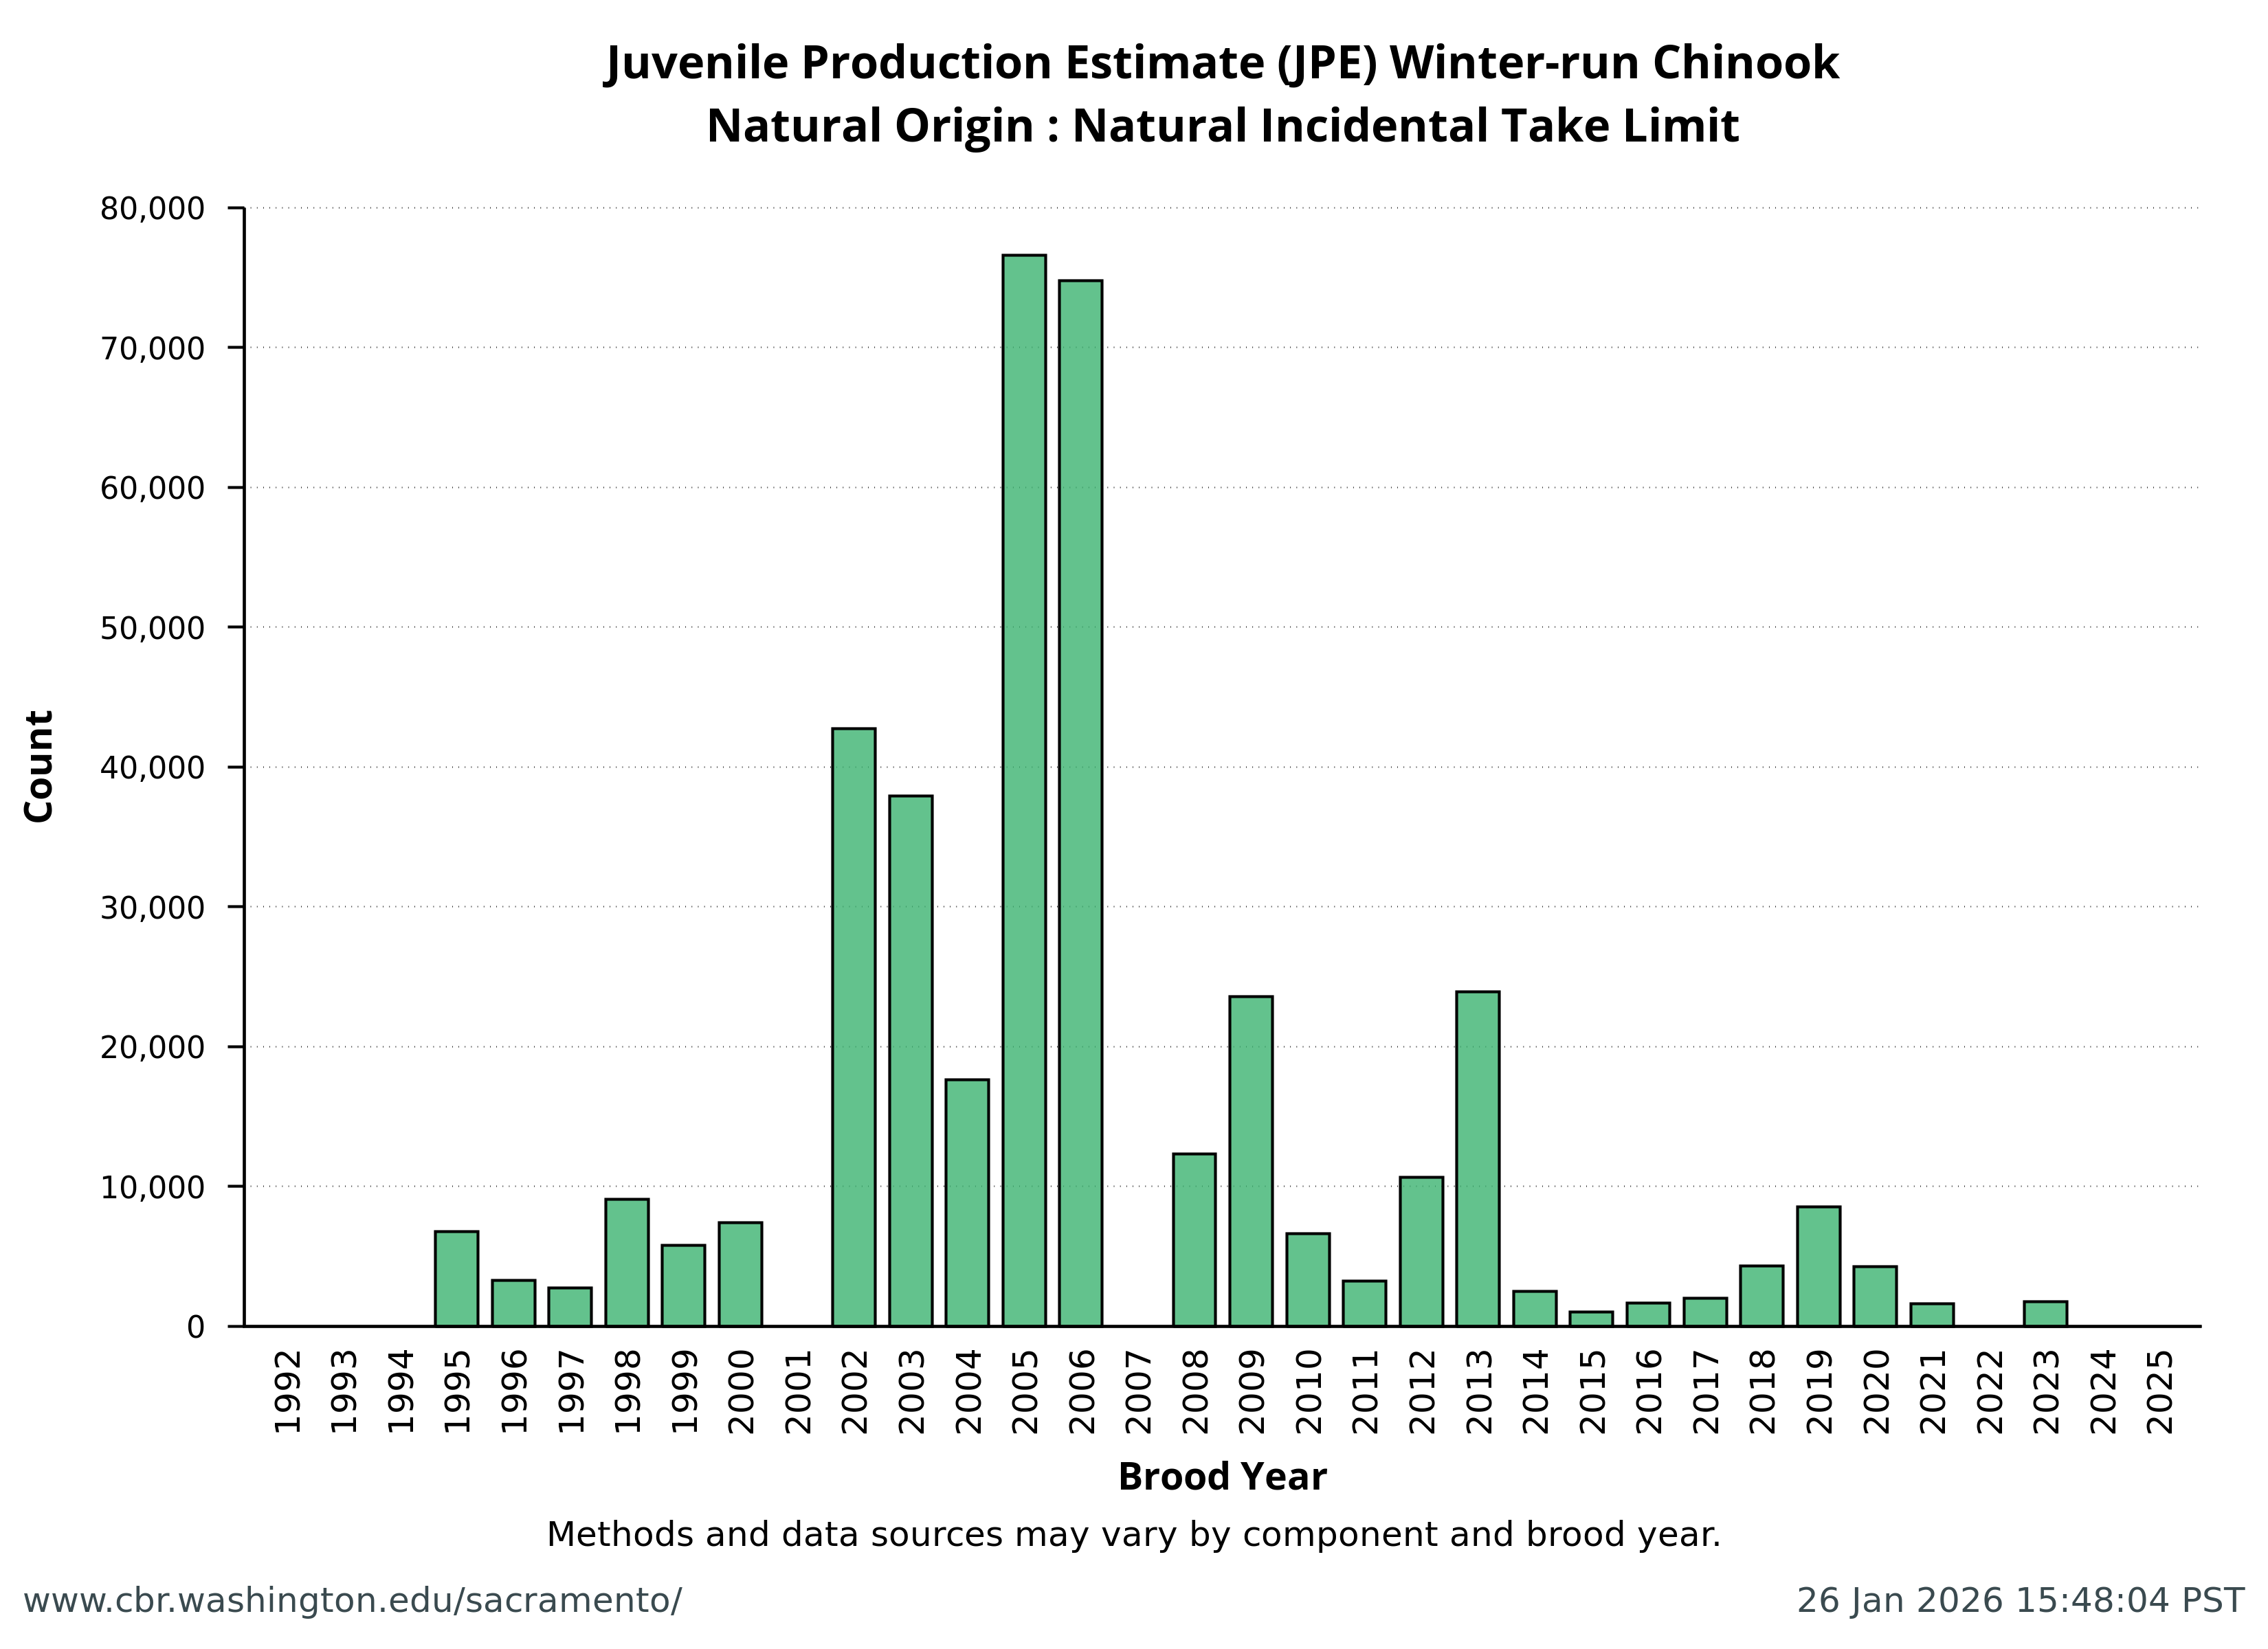

| Brood Year | Value | Component | Origin | JPE letter date | Footnote | References & Contributors | Lower 95% CI | Upper 95% CI |
|---|---|---|---|---|---|---|---|---|
| 1992 | NA | Natural Incidental Take Limit | Natural | NA | NA | NA | NA | NA |
| 1993 | NA | Natural Incidental Take Limit | Natural | NA | NA | NA | NA | NA |
| 1994 | NA | Natural Incidental Take Limit | Natural | NA | NA | NA | NA | NA |
| 1995 | 6,762 | Natural Incidental Take Limit | Natural | 1995-10-20 | NA | NA | NA | NA |
| 1996 | 3,301 | Natural Incidental Take Limit | Natural | 1997-02-10 | NA | NA | NA | NA |
| 1997 | 2,766 | Natural Incidental Take Limit | Natural | 1998-04-27 | NA | NA | NA | NA |
| 1998 | 9,095 | Natural Incidental Take Limit | Natural | 1999-02-26 | NA | NA | NA | NA |
| 1999 | 5,794 | Natural Incidental Take Limit | Natural | 2000-01-01 | NA | NA | NA | NA |
| 2000 | 7,404 | Natural Incidental Take Limit | Natural | 2001-01-29 | NA | NA | NA | NA |
| 2001 | NA | Natural Incidental Take Limit | Natural | NA | NA | NA | NA | NA |
| 2002 | 42,735 | Natural Incidental Take Limit | Natural | 2003-02-19 | NA | NA | NA | NA |
| 2003 | 37,933 | Natural Incidental Take Limit | Natural | 2004-01-21 | NA | NA | NA | NA |
| 2004 | 17,634 | Natural Incidental Take Limit | Natural | 2005-02-08 | NA | NA | NA | NA |
| 2005 | 76,626 | Natural Incidental Take Limit | Natural | 2006-02-10 | NA | NA | NA | NA |
| 2006 | 74,781 | Natural Incidental Take Limit | Natural | 2007-02-15 | NA | NA | NA | NA |
| 2007 | NA | Natural Incidental Take Limit | Natural | NA | NA | NA | NA | NA |
| 2008 | 12,356 | Natural Incidental Take Limit | Natural | 2009-01-12 | NA | NA | NA | NA |
| 2009 | 23,593 | Natural Incidental Take Limit | Natural | 2010-02-24 | NA | NA | NA | NA |
| 2010 | 6,640 | Natural Incidental Take Limit | Natural | 2011-01-12 | NA | NA | NA | NA |
| 2011 | 3,241 | Natural Incidental Take Limit | Natural | 2012-01-26 | NA | NA | NA | NA |
| 2012 | 10,656 | Natural Incidental Take Limit | Natural | 2013-01-31 | NA | NA | NA | NA |
| 2013 | 23,928 | Natural Incidental Take Limit | Natural | 2014-02-21 | NA | NA | NA | NA |
| 2014 | 2,490 | Natural Incidental Take Limit | Natural | 2015-01-16 | NA | NA | NA | NA |
| 2015 | 1,017 | Natural Incidental Take Limit | Natural | 2016-01-28 | NA | NA | NA | NA |
| 2016 | 1,662 | Natural Incidental Take Limit | Natural | 2017-02-03 | NA | NA | NA | NA |
| 2017 | 2,014 | Natural Incidental Take Limit | Natural | 2018-01-08 | NA | NA | NA | NA |
| 2018 | 4,332 | Natural Incidental Take Limit | Natural | 2019-02-01 | NA | NA | NA | NA |
| 2019 | 8,549 | Natural Incidental Take Limit | Natural | 2020-01-23 | NA | NA | NA | NA |
| 2020 | 4,292 | Natural Incidental Take Limit | Natural | 2021-01-15 | NA | NA | NA | NA |
| 2021 | 1,625 | Natural Incidental Take Limit | Natural | 2022-01-14 | NA | NA | NA | NA |
| 2022 | NA | Natural Incidental Take Limit | Natural | NA | NA | NA | NA | NA |
| 2023 | 1,776 | Natural Incidental Take Limit | Natural | 2024-01-12 | NA | NA | NA | NA |
| 2024 | NA | Natural Incidental Take Limit | Natural | NA | NA | NA | NA | NA |
| 2025 | NA | Natural Incidental Take Limit | Natural | NA | NA | NA | NA | NA |
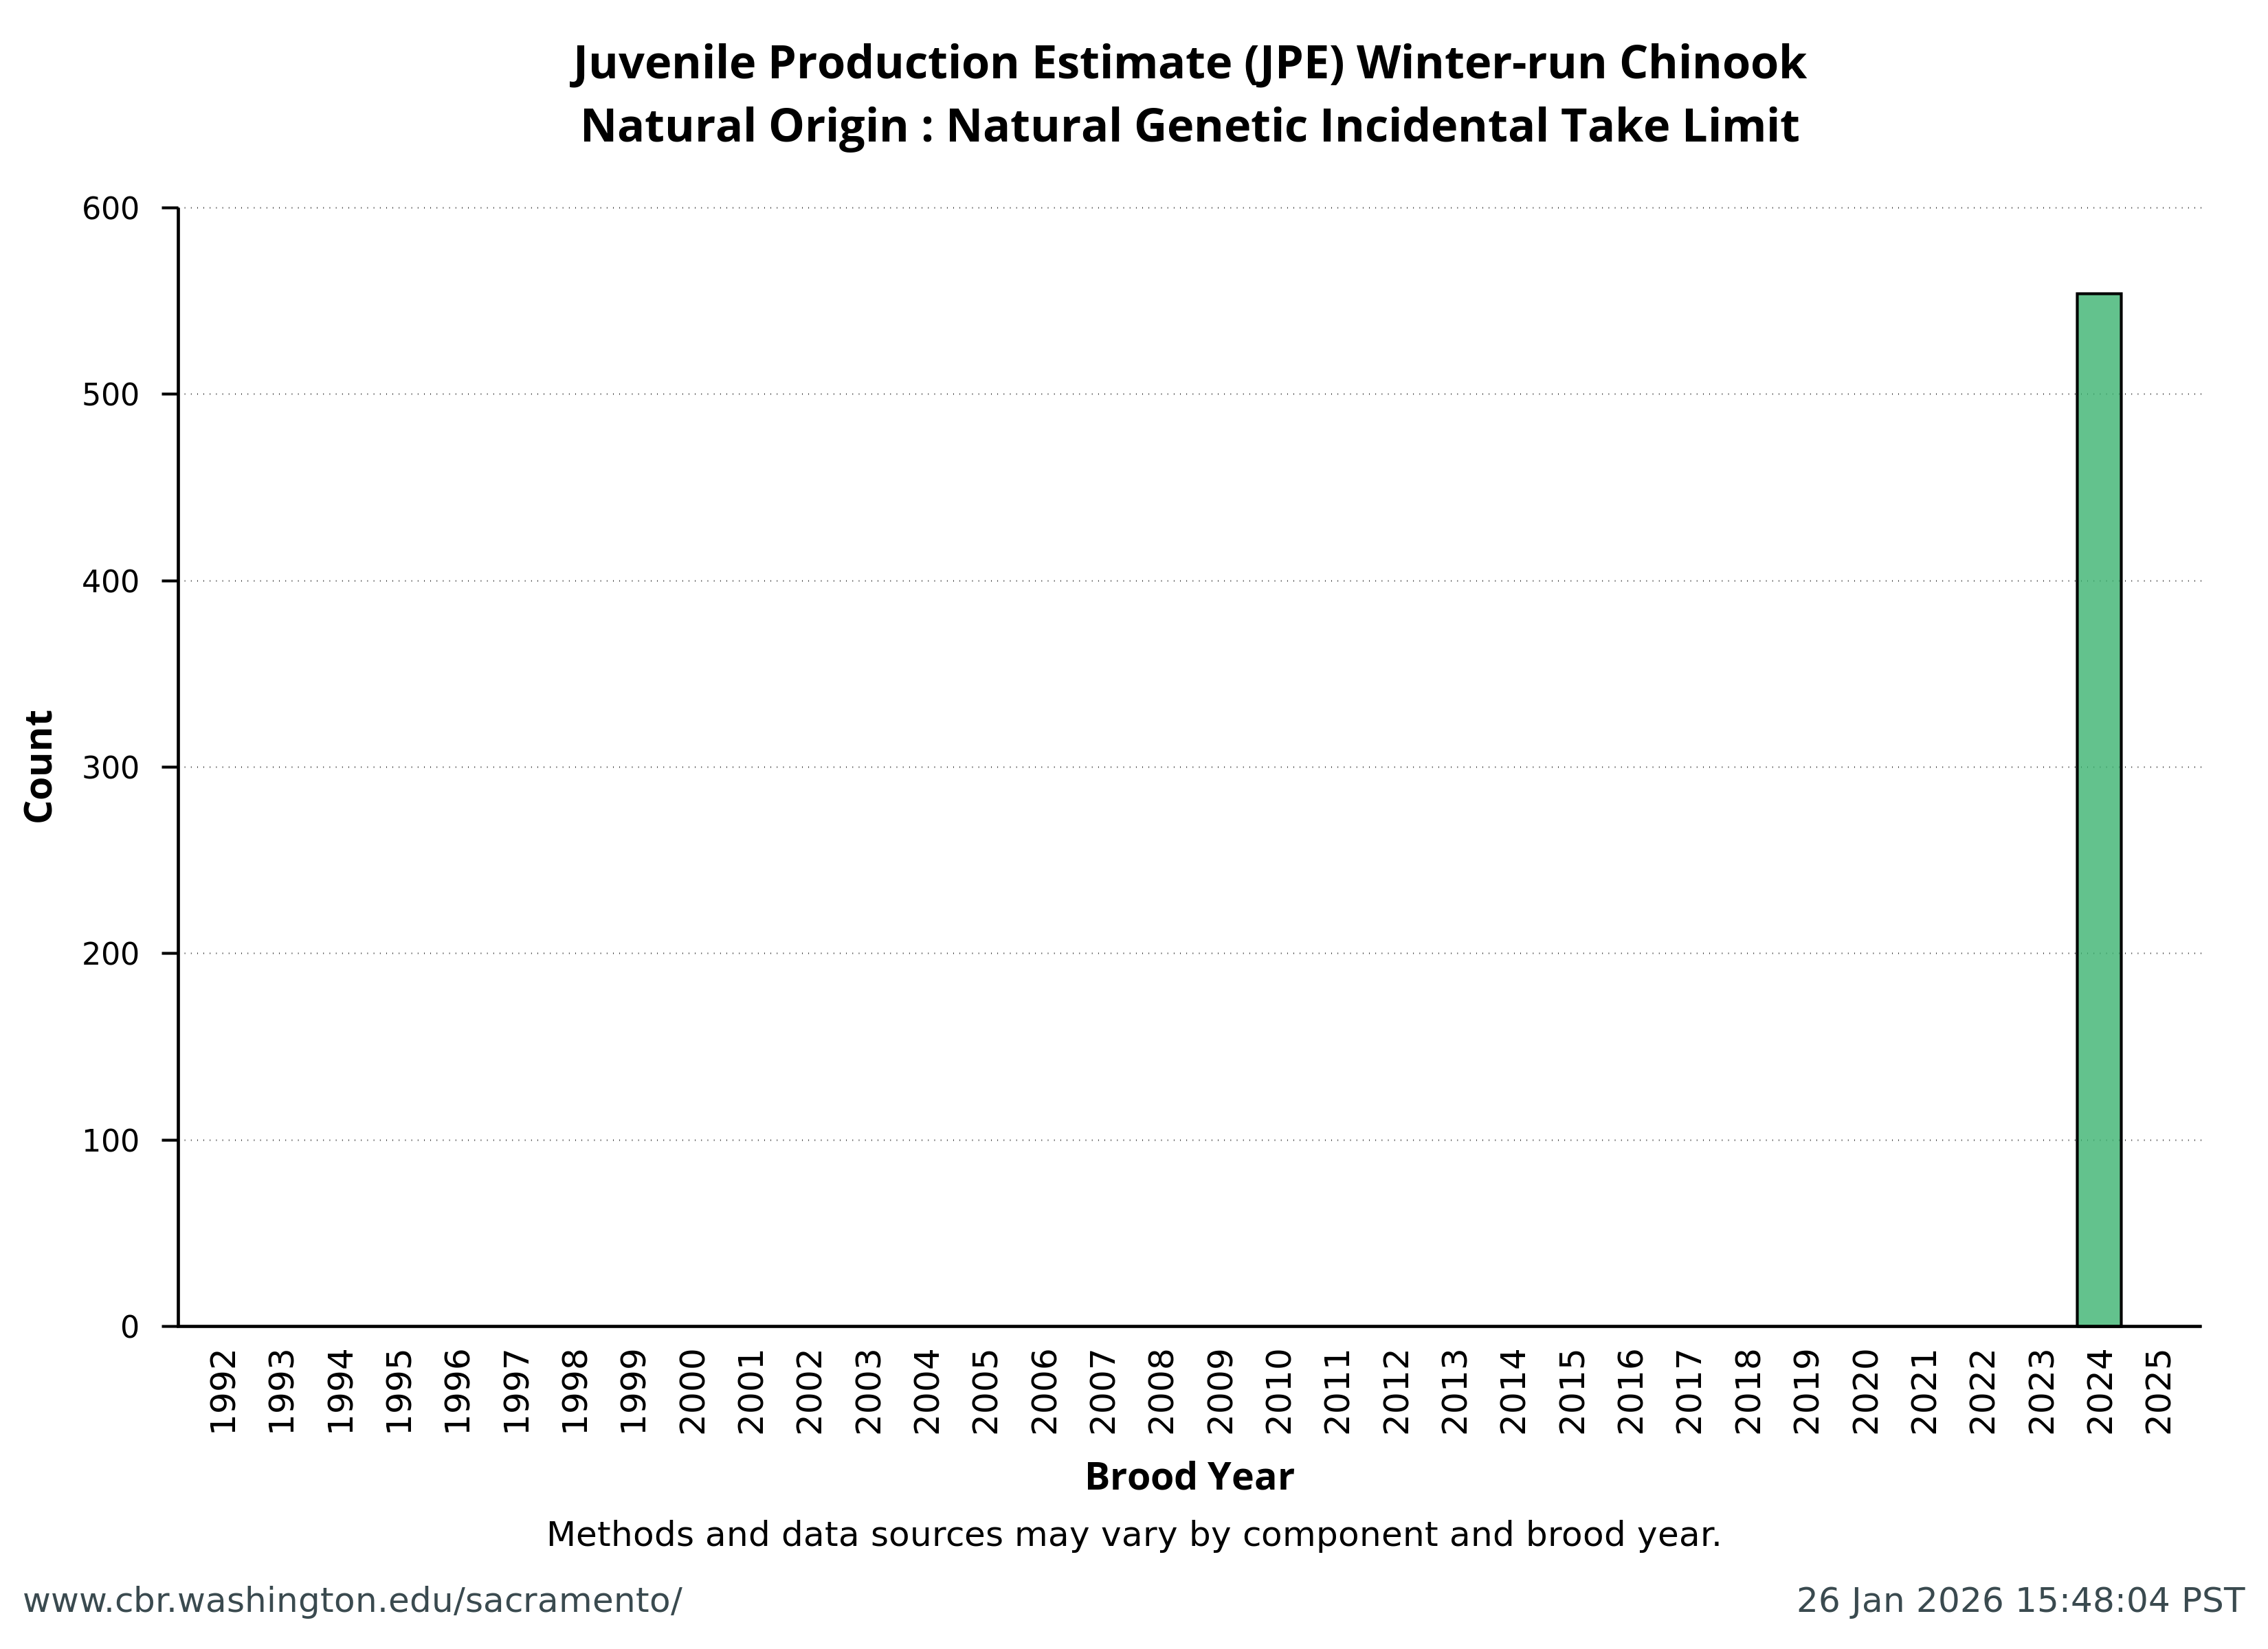
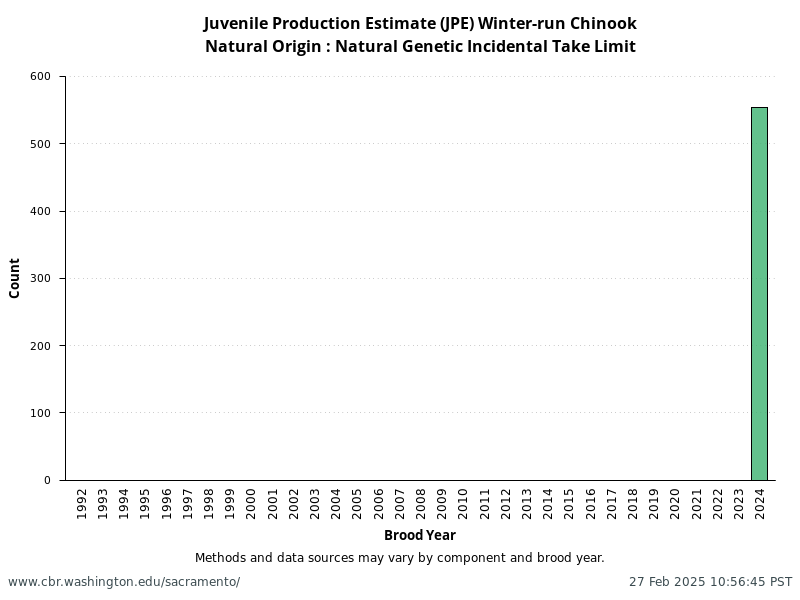
Natural Origin: Natural Genetic Incidental Take Limit
| Brood Year | Value | Component | Origin | JPE letter date | Footnote | References & Contributors | Lower 95% CI | Upper 95% CI |
|---|---|---|---|---|---|---|---|---|
| 1992 | NA | Natural Genetic Incidental Take Limit | Natural | NA | NA | NA | NA | NA |
| 1993 | NA | Natural Genetic Incidental Take Limit | Natural | NA | NA | NA | NA | NA |
| 1994 | NA | Natural Genetic Incidental Take Limit | Natural | NA | NA | NA | NA | NA |
| 1995 | NA | Natural Genetic Incidental Take Limit | Natural | NA | NA | NA | NA | NA |
| 1996 | NA | Natural Genetic Incidental Take Limit | Natural | NA | NA | NA | NA | NA |
| 1997 | NA | Natural Genetic Incidental Take Limit | Natural | NA | NA | NA | NA | NA |
| 1998 | NA | Natural Genetic Incidental Take Limit | Natural | NA | NA | NA | NA | NA |
| 1999 | NA | Natural Genetic Incidental Take Limit | Natural | NA | NA | NA | NA | NA |
| 2000 | NA | Natural Genetic Incidental Take Limit | Natural | NA | NA | NA | NA | NA |
| 2001 | NA | Natural Genetic Incidental Take Limit | Natural | NA | NA | NA | NA | NA |
| 2002 | NA | Natural Genetic Incidental Take Limit | Natural | NA | NA | NA | NA | NA |
| 2003 | NA | Natural Genetic Incidental Take Limit | Natural | NA | NA | NA | NA | NA |
| 2004 | NA | Natural Genetic Incidental Take Limit | Natural | NA | NA | NA | NA | NA |
| 2005 | NA | Natural Genetic Incidental Take Limit | Natural | NA | NA | NA | NA | NA |
| 2006 | NA | Natural Genetic Incidental Take Limit | Natural | NA | NA | NA | NA | NA |
| 2007 | NA | Natural Genetic Incidental Take Limit | Natural | NA | NA | NA | NA | NA |
| 2008 | NA | Natural Genetic Incidental Take Limit | Natural | NA | NA | NA | NA | NA |
| 2009 | NA | Natural Genetic Incidental Take Limit | Natural | NA | NA | NA | NA | NA |
| 2010 | NA | Natural Genetic Incidental Take Limit | Natural | NA | NA | NA | NA | NA |
| 2011 | NA | Natural Genetic Incidental Take Limit | Natural | NA | NA | NA | NA | NA |
| 2012 | NA | Natural Genetic Incidental Take Limit | Natural | NA | NA | NA | NA | NA |
| 2013 | NA | Natural Genetic Incidental Take Limit | Natural | NA | NA | NA | NA | NA |
| 2014 | NA | Natural Genetic Incidental Take Limit | Natural | NA | NA | NA | NA | NA |
| 2015 | NA | Natural Genetic Incidental Take Limit | Natural | NA | NA | NA | NA | NA |
| 2016 | NA | Natural Genetic Incidental Take Limit | Natural | NA | NA | NA | NA | NA |
| 2017 | NA | Natural Genetic Incidental Take Limit | Natural | NA | NA | NA | NA | NA |
| 2018 | NA | Natural Genetic Incidental Take Limit | Natural | NA | NA | NA | NA | NA |
| 2019 | NA | Natural Genetic Incidental Take Limit | Natural | NA | NA | NA | NA | NA |
| 2020 | NA | Natural Genetic Incidental Take Limit | Natural | NA | NA | NA | NA | NA |
| 2021 | NA | Natural Genetic Incidental Take Limit | Natural | NA | NA | NA | NA | NA |
| 2022 | NA | Natural Genetic Incidental Take Limit | Natural | NA | NA | NA | NA | NA |
| 2023 | NA | Natural Genetic Incidental Take Limit | Natural | NA | NA | NA | NA | NA |
| 2024 | 554 | Natural Genetic Incidental Take Limit | Natural | 2025-01-10 | NA | NA | NA | NA |
| 2025 | NA | Natural Genetic Incidental Take Limit | Natural | NA | NA | NA | NA | NA |
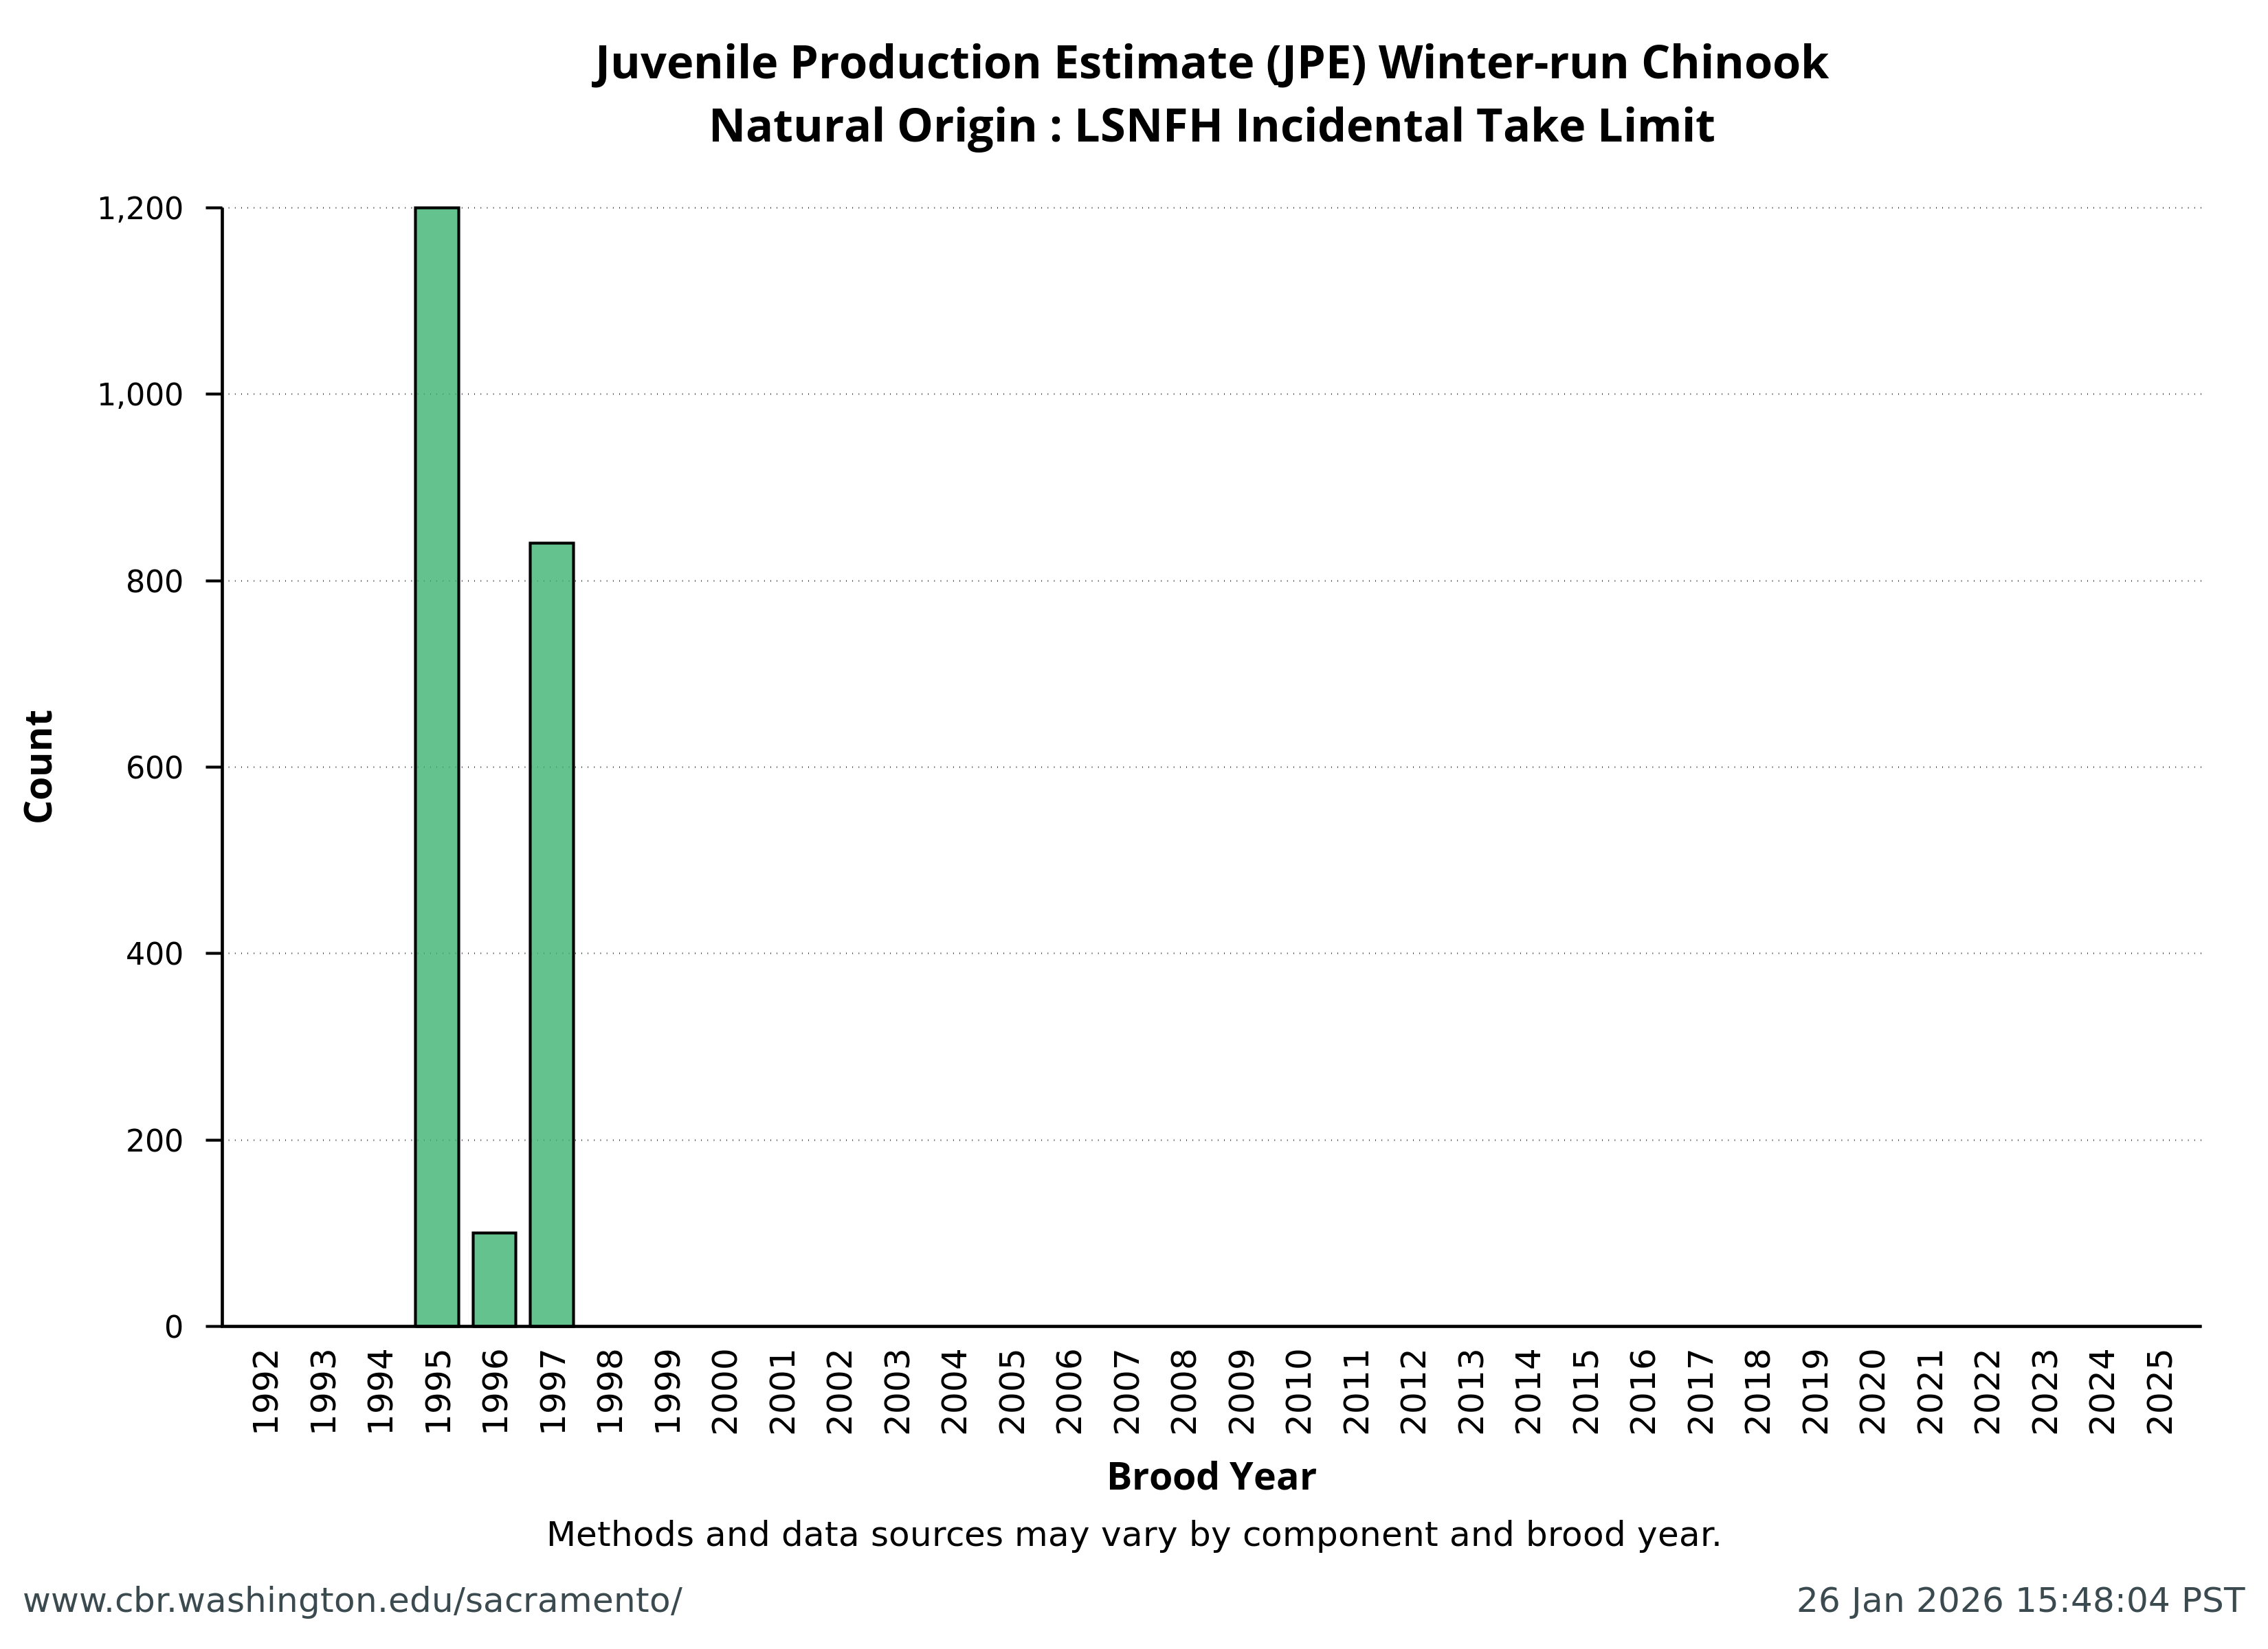
Natural Origin: LSNFH Incidental Take Limit

| Brood Year | Value | Component | Origin | JPE letter date | Footnote | References & Contributors | Lower 95% CI | Upper 95% CI |
|---|---|---|---|---|---|---|---|---|
| 1992 | NA | LSNFH Incidental Take Limit | Natural | NA | NA | NA | NA | NA |
| 1993 | NA | LSNFH Incidental Take Limit | Natural | NA | NA | NA | NA | NA |
| 1994 | NA | LSNFH Incidental Take Limit | Natural | NA | NA | NA | NA | NA |
| 1995 | 1,200 | LSNFH Incidental Take Limit | Natural | 1995-10-20 | NA | NA | NA | NA |
| 1996 | 100 | LSNFH Incidental Take Limit | Natural | 1997-02-10 | NA | NA | NA | NA |
| 1997 | 840 | LSNFH Incidental Take Limit | Natural | 1998-04-27 | NA | NA | NA | NA |
| 1998 | NA | LSNFH Incidental Take Limit | Natural | NA | NA | NA | NA | NA |
| 1999 | NA | LSNFH Incidental Take Limit | Natural | NA | NA | NA | NA | NA |
| 2000 | NA | LSNFH Incidental Take Limit | Natural | NA | NA | NA | NA | NA |
| 2001 | NA | LSNFH Incidental Take Limit | Natural | NA | NA | NA | NA | NA |
| 2002 | NA | LSNFH Incidental Take Limit | Natural | NA | NA | NA | NA | NA |
| 2003 | NA | LSNFH Incidental Take Limit | Natural | NA | NA | NA | NA | NA |
| 2004 | NA | LSNFH Incidental Take Limit | Natural | NA | NA | NA | NA | NA |
| 2005 | NA | LSNFH Incidental Take Limit | Natural | NA | NA | NA | NA | NA |
| 2006 | NA | LSNFH Incidental Take Limit | Natural | NA | NA | NA | NA | NA |
| 2007 | NA | LSNFH Incidental Take Limit | Natural | NA | NA | NA | NA | NA |
| 2008 | NA | LSNFH Incidental Take Limit | Natural | NA | NA | NA | NA | NA |
| 2009 | NA | LSNFH Incidental Take Limit | Natural | NA | NA | NA | NA | NA |
| 2010 | NA | LSNFH Incidental Take Limit | Natural | NA | NA | NA | NA | NA |
| 2011 | NA | LSNFH Incidental Take Limit | Natural | NA | NA | NA | NA | NA |
| 2012 | NA | LSNFH Incidental Take Limit | Natural | NA | NA | NA | NA | NA |
| 2013 | NA | LSNFH Incidental Take Limit | Natural | NA | NA | NA | NA | NA |
| 2014 | NA | LSNFH Incidental Take Limit | Natural | NA | NA | NA | NA | NA |
| 2015 | NA | LSNFH Incidental Take Limit | Natural | NA | NA | NA | NA | NA |
| 2016 | NA | LSNFH Incidental Take Limit | Natural | NA | NA | NA | NA | NA |
| 2017 | NA | LSNFH Incidental Take Limit | Natural | NA | NA | NA | NA | NA |
| 2018 | NA | LSNFH Incidental Take Limit | Natural | NA | NA | NA | NA | NA |
| 2019 | NA | LSNFH Incidental Take Limit | Natural | NA | NA | NA | NA | NA |
| 2020 | NA | LSNFH Incidental Take Limit | Natural | NA | NA | NA | NA | NA |
| 2021 | NA | LSNFH Incidental Take Limit | Natural | NA | NA | NA | NA | NA |
| 2022 | NA | LSNFH Incidental Take Limit | Natural | NA | NA | NA | NA | NA |
| 2023 | NA | LSNFH Incidental Take Limit | Natural | NA | NA | NA | NA | NA |
| 2024 | NA | LSNFH Incidental Take Limit | Natural | NA | NA | NA | NA | NA |
| 2025 | NA | LSNFH Incidental Take Limit | Natural | NA | NA | NA | NA | NA |
References:
O'Farrell, M. R., Satterthwaite, W. H., Hendrix, A. N., & Mohr, M. S. (2018). Alternative Juvenile Production Estimate (JPE) forecast approaches for Sacramento River Winter-Run Chinook Salmon. San Francisco Estuary and Watershed Science, 16(4).
Voss, S. D., and W. R. Poytress. 2020. Brood Year 2018 Juvenile Salmonid Production and Passage Indices at the Red Bluff Diversion Dam (2018 Annual RBDD Juvenile Fish Monitoring Report). Report by the Red Bluff Fish and Wildlife Office, U.S. Fish and Wildlife Service, Red Bluff, California, prepared for the U.S. Bureau of Reclamation, Sacramento, California.
Voss, S. D., and W. R. Poytress. 2022a. 2019 Red Bluff Diversion Dam Rotary Trap Juvenile Anadromous Fish Abundance Estimates. Report by the Red Bluff Fish and Wildlife Office, U.S. Fish and Wildlife Service, Red Bluff, California, prepared for the U.S. Bureau of Reclamation, Sacramento, California.
Voss, S. D., and W. R. Poytress. 2022b. 2020 Red Bluff Diversion Dam Rotary Trap Juvenile Anadromous Fish Abundance Estimates. Report by the Red Bluff Fish and Wildlife Office, U.S. Fish and Wildlife Service, Red Bluff, California, prepared for the U.S. Bureau of Reclamation, Sacramento, California.
Voss, S. D., and W. R. Poytress. 2023. 2021 Red Bluff Diversion Dam Rotary Trap Juvenile Anadromous Fish Abundance Estimates. Report by the Red Bluff Fish and Wildlife Office, U.S. Fish and Wildlife Service, Red Bluff, California, prepared for the U.S. Bureau of Reclamation, Sacramento, California.