

By February 1 of each year, this webpage summarizes multiple indicators of Winter-run Chinook Salmon migrating downstream and upstream the Sacramento River in the current year, as described in section 3.3.3 of the Proposed Action (Reclamation 2024). The indicators represent the previous broodyear’s cohort of outmigrants and the return adults from the broodyear 3 years ago. These indicators would inform "operations, risk tradeoffs for determining the downstream extent of water temperature management, and the need to pursue increasing production or taking other actions at LSNFH". For full description, see PA 3.3.3 Quoted Text. Broodyear Assessment indicators for historical years are also available on this webpage.
Current Brood Year Assessment Indicators
| Assessment Year | Brood Year | Adult Return Year; BY of Adults | >30% TDM | <20% ETF Survival | 25% JPE (Natural Origin) 3-year Mean | 25% JPE (Natural Origin) 10-year Mean | 25% JPE (Natural Origin) All Years Mean | Outyear Adult Escapement Forecast |
|---|---|---|---|---|---|---|---|---|
| 2025 | 2025 | 2025; 2022 | No | Yes | 115936.8 | 88801.2 | 187527.3 | 4507 |
Winter Chinook Indicators Summary
| Assessment Year | Brood Year | Adult Return Year; BY of Adults | >30% TDM | <20% ETF Survival | 25% JPE (Natural Origin) 3-year Mean | 25% JPE (Natural Origin) 10-year Mean | 25% JPE (Natural Origin) All Years Mean | Outyear Adult Escapement Forecast |
|---|---|---|---|---|---|---|---|---|
| 2025 | 2025 | 2025; 2022 | No | Yes | 115936.8 | 88801.2 | 187527.3 | 4507 |
| 2024 | 2024 | 2024; 2021 | No | No | 31976.1 | 64907.8 | 181189.0 | 1013 |
| 2023 | 2023 | 2023; 2020 | No | No | 34154.8 | 65548.5 | 186236.3 | 4540 |
| 2022 | 2022 | 2022; 2019 | No | Yes | 42091.0 | 89585.8 | 190486.7 | 5971 |
| 2021 | 2021 | 2021; 2018 | Yes | Yes | 109175.8 | 101657.9 | 196624.8 | 9063 |
| 2020 | 2020 | 2020; 2017 | No | Yes | 134853.9 | 102583.2 | 202530.7 | 3077 |
| 2019 | 2019 | 2019; 2016 | No | Yes | 124127.2 | 102630.3 | 206975.1 | 1924 |
| 2018 | 2018 | 2018; 2015 | No | No | 66731.2 | 110747.6 | 206715.1 | 1594 |
| 2017 | 2017 | No | No | 39109.5 | 115362.8 | 210652.0 | ||
| 2016 | 2016 | No | No | 32702.2 | 122586.1 b | 217331.1 | ||
| 2015 | 2015 | Yes | Yes | 118552.0 | 221832.8 b | 224973.9 | ||
| 2014 | 2014 | Yes | Yes | 154476.4 | 325432.0 b | 234044.1 | ||
| 2013 | 2013 | No | No | 157603.9 | 346465.3 b | 243706.7 | ||
| 2012 | 2012 | No | No | 85572.7 | 365917.0 b | 240937.2 | ||
| 2011 | 2011 | No | No | 139474.7 | 410470.8 b | 246607.4 | ||
| 2010 | 2010 | No | NA | 177452.3 | 457769.4 b | 258057.1 | ||
| 2009 | 2009 | No | NA | 224677.0 a | 458830.8 b | 510103.1 | ||
| 2008 | 2008 | Yes | NA | 544606.5 a | 434111.1 b | 266694.8 | ||
| 2007 | 2007 | No | NA | 946294.4 a | 429583.6 b | 274178.1 | ||
| 2006 | 2006 | No | NA | 704339.5 | 390083.1 | 274178.1 | ||
| 2005 | 2005 | No | NA | 550804.5 | 300733.1 | 226993.1 | ||
| 2004 | 2004 | No | NA | 409592.9 | 213403.7 | 170775.6 | ||
| 2003 | 2003 | No | NA | 491516.5 | 192148.0 | 166637.7 | ||
| 2002 | 2002 | No | NA | 364314.2 | 146395.1 | 138681.0 | ||
| 2001 | 2001 | NA | NA | 210395.6 | 99130.4 | 99130.4 | ||
| 2000 | 2000 | NA | No | 92894.8 | NA | |||
| 1999 | 1999 | NA | No | 73569.3 | NA | |||
| 1998 | 1998 | NA | No | 63181.4 | NA | |||
| 1997 | 1997 | NA | No | 53457.7 | NA | |||
| 1996 | 1996 | NA | No | 44555.6 | NA | |||
| 1995 | 1995 | NA | No | 36344.5 | NA | |||
| 1994 | 1994 | NA | No | 28682.0 | NA | |||
| 1993 | 1993 | NA | No | NA | NA | |||
| 1992 | 1992 | NA | No | NA | NA |
- JPE for 2007 is missing; therefore only 2 years available for calculation.
- JPE for 2007 is missing; therefore only 9 years available for calculation.
Temperature-dependent Mortality (TDM)
Annual update to TDM estimates available November/December.
Related SacPAS resource: SacPAS Fish Model
| Brood Year | TDM using Anderson et. al (2022) | Anderson-TDM Exceed 30% | TDM using Martin et. al (2017) | Martin-TDM Exceed 30% |
|---|---|---|---|---|
| 2025 | 0.0000 | No | 0.0000 | No |
| 2024 | 0.0065 | No | 0.0034 | No |
| 2023 | 0.0000 | No | 0.0000 | No |
| 2022 | 0.0702 | No | 0.1648 | No |
| 2021 | 0.7347 | Yes | 0.7553 | Yes |
| 2020 | 0.0114 | No | 0.0196 | No |
| 2019 | 0.0041 | No | 0.0020 | No |
| 2018 | 0.0001 | No | 0.0164 | No |
| 2017 | 0.0176 | No | 0.0030 | No |
| 2016 | 0.0039 | No | 0.0024 | No |
| 2015 | 0.8772 | Yes | 0.8404 | Yes |
| 2014 | 0.7642 | Yes | 0.7609 | Yes |
| 2013 | 0.1142 | No | 0.0649 | No |
| 2012 | 0.0000 | No | 0.0000 | No |
| 2011 | 0.0000 | No | 0.0000 | No |
| 2010 | 0.0000 | No | 0.0009 | No |
| 2009 | 0.1562 | No | 0.0974 | No |
| 2008 | 0.3929 | Yes | 0.3008 | Yes |
| 2007 | 0.0630 | No | 0.1084 | No |
| 2006 | 0.0001 | No | 0.0000 | No |
| 2005 | 0.0119 | No | 0.0526 | No |
| 2004 | 0.0112 | No | 0.2664 | No |
| 2003 | 0.0026 | No | 0.0000 | No |
| 2002 | 0.0000 | No | 0.0008 | No |
Egg-to-fry (ETF) Survival
Annual update to ETF Survival from JPE Letter available January/February.
Related SacPAS resource: Juvenile Production Estimates (JPE) for Sacramento River Winter-run Chinook Salmon
| Brood year | ETF Survival | ETF Survival <20% | JPE Letter Date | JPE Letter Footnote | JPE Letter References & Contributors |
|---|---|---|---|---|---|
| 2025 | 0.1273 | Yes | 2026-01-08 | 5/ Back calculated estimated survival between eggs laid in-river and fry production estimates at RBDD based on numbers of fry equivalents (JPI) using the 0.5217 fry-to-smolt survival rate estimate based on method described in O’Farrell et al. (2018). | CDFW, LSNFH, USFWS |
| 2024 | 0.2884 | No | 2025-01-10 | 5/ Back calculated estimated survival between eggs laid in-river and fry production estimates at RBDD based on numbers of fry equivalents (JPI) using the 0.5149 fry-to-smolt survival rate estimate based on method described in O’Farrell et al. (2018). | CDFW, LSNFH, USFWS |
| 2023 | 0.2494 | No | 2024-01-12 | 5/ Back calculated estimated survival between eggs laid in-river and fry production estimates at RBDD based on numbers of fry equivalents (JPI) using the 0.5066 fry-to-smolt survival rate estimate based on method described in O’Farrell et al. (2018). | CDFW, LSNFH, USFWS |
| 2022 | 0.0217 | Yes | 2023-01-13 | 5/ Back calculated estimated survival between eggs laid in-river and fry production estimates at RBDD based on numbers of fry equivalents (JPI) using the 0.4946 fry-to-smolt survival rate estimate based on method described in O’Farrell et al. (2018). | CDFW, LSNFH, USFWS |
| 2021 | 0.0256 | Yes | 2022-01-14 | 5/ Back calculated survival between estimated eggs laid in-river and fry production estimates at RBDD based on numbers of fry equivalents (JPI) using the 0.4429 fry-to-smolt survival rate estimate based on method described in O’Farrell et al. (2018). | CDFW, LSNFH, USFWS |
| 2020 | 0.1146 | Yes | 2021-01-15 | 5/ Back-calculated estimated survival between eggs laid in-river and fry production estimates at RBDD based on numbers of fry equivalents (JPI) using the 0.4475 fry-to-smolt survival rate estimate method described in O’Farrell et al. (2018). | CDFW, LSNFH, USFWS |
| 2019 | 0.1798 | Yes | 2020-01-23 | 5/ Back calculated estimated survival between eggs laid in-river and fry production estimates at RBDD based on numbers of fry equivalents (JPI) using the 0.4651 fry-to-smolt survival rate estimate based on method described in O’Farrell et al. (2018). | CDFW, LSNFH, USFWS |
| 2018 | 0.263 | No | 2019-02-01 | 5/ Back calculated estimated survival between eggs laid in-river and fry production estimates at RBDD based on numbers of fry equivalents (JPI) using traditional (59%) fry-to-smolt survival estimates | CDFW, LSNFH, USFWS |
| 2017 | 0.44 | No | 2018-01-08 | NA | CDFW, LSNFH, USFWS |
| 2016 | 0.24 | No | 2017-02-03 | NA | CDFW, LSNFH, USFWS |
| 2015 | 0.042 | Yes | 2016-01-28 | NA | CDFW, LSNFH, USFWS |
| 2014 | 0.056 | Yes | 2015-01-16 | NA | CDFW, LSNFH, USFWS |
| 2013 | 0.27 | No | 2014-02-21 | NA | CDFW, LSNFH, USFWS |
| 2012 | 0.25 | No | 2013-01-31 | 6/ Survival measured at Red Bluff based on JPI/female spawners in carcass survey, and fecundity data (J. Smith, USFWS, 12/7/11 WRPWT notes) | CDFW, LSNFH, USFWS |
| 2011 | 0.25 | No | 2012-01-26 | 6/ This is measured at Red Bluff based on female spawners, carcass survey females, JPI/female spawner, and fecundity data (J. Smith, FWS, 12/7/11 WRPWT notes) | CDFW, LSNFH, USFWS |
| 2010 | NA | NA | NA | NA | NA |
| 2009 | NA | NA | NA | NA | NA |
| 2008 | NA | NA | NA | NA | NA |
| 2007 | NA | NA | NA | NA | NA |
| 2006 | NA | NA | NA | NA | NA |
| 2005 | NA | NA | NA | NA | NA |
| 2004 | NA | NA | NA | NA | NA |
| 2003 | NA | NA | NA | NA | NA |
| 2002 | NA | NA | NA | NA | NA |
| 2001 | NA | NA | NA | NA | NA |
| 2000 | 0.25 | No | 2001-01-29 | NA | CDFW, LSNFH, USFWS |
| 1999 | 0.25 | No | 2000-01-01 | NA | CDFW, LSNFH, USFWS |
| 1998 | 0.25 | No | 1999-02-26 | NA | CDFW, LSNFH, USFWS |
| 1997 | 0.25 | No | 1998-04-27 | NA | CDFW, LSNFH, USFWS |
| 1996 | 0.25 | No | 1997-02-10 | NA | CDFW, LSNFH, USFWS |
| 1995 | 0.25 | No | 1995-10-20 | NA | CDFW, LSNFH, USFWS |
| 1994 | 0.25 | No | 1995-02-21 | NA | CDFW, LSNFH, USFWS |
| 1993 | 0.25 | No | 1993-10-01 | NA | CDFW, LSNFH, USFWS |
| 1992 | 0.25 | No | 1993-02-09 | NA | CDFW, LSNFH, USFWS |
Juvenile Production Estimate (JPE)
Annual update to JPE Letter available January/February.
Related SacPAS resource: Juvenile Production Estimates (JPE) for Sacramento River Winter-run Chinook Salmon
| Brood year | Total natural production entering the Delta | JPE Letter Date | JPE Letter References & Contributors | Lower 95% CI | Upper 95% CI | 3-year Mean | 10-year Mean | All Years (to date) Mean | 25% of 3-year Mean | 25% of 10-year Mean | 25% of All Years (to date) Mean |
|---|---|---|---|---|---|---|---|---|---|---|---|
| 2025 | 1057452 | 2026-01-08 | Method 2 (O'Farrell et. al 2018) with data from USFWS, UC Santa Cruz, and SWFSC | NA | NA | 463747 | 355204.8 | 750109.0 | 115936.8 | 88801.2 | 187527.3 |
| 2024 | 98893 | 2025-01-10 | Method 2 (O'Farrell et. al 2018) with data from USFWS, UC Santa Cruz, and SWFSC | NA | NA | 127904.3 | 259631.2 | 724756.0 | 31976.1 | 64907.8 | 181189.0 |
| 2023 | 234896 | 2024-01-12 | Method 2 (O'Farrell et. al 2018) with data from USFWS, UC Santa Cruz, and SWFSC | 159951 | 309841 | 136619.3 | 262194 | 744945.2 | 34154.8 | 65548.5 | 186236.3 |
| 2022 | 49924 | 2023-01-13 | Method 2 (O'Farrell et. al 2018) with data from USFWS, UC Santa Cruz, and SWFSC | 32298 | 67550 | 168364 | 358343.1 | 761946.8 | 42091 | 89585.78 | 190486.7 |
| 2021 | 125038 | 2022-01-14 | Method 2 (O'Farrell et. al 2018) with data from USFWS, UC Santa Cruz, and SWFSC | 59064 | 191013 | 436703 | 406631.6 | 786499.3 | 109175.8 | 101657.9 | 196624.8 |
| 2020 | 330130 | 2021-01-15 | Method 2 (O'Farrell et. al 2018) with data from USFWS, UC Santa Cruz, and SWFSC | 145088 | 515172 | 539415.7 | 410332.9 | 810122.9 | 134853.9 | 102583.2 | 202530.7 |
| 2019 | 854941 | 2020-01-23 | Method 2 (O'Farrell et. al 2018) with data from USFWS, UC Santa Cruz, and SWFSC | 301002 | 1408880 | 496508.7 | 410521.1 | 827900.4 | 124127.2 | 102630.3 | 206975.1 |
| 2018 | 433176 | 2019-02-01 | NA | NA | NA | 266924.7 | 442990.3 | 826860.4 | 66731.2 | 110747.6 | 206715.1 |
| 2017 | 201409 | 2018-01-08 | NA | NA | NA | 156438 | 461451 | 842607.8 | 39109.5 | 115362.8 | 210652.0 |
| 2016 | 166189 | 2017-02-03 | NA | NA | NA | 130808.7 | 490344.6 b | 869324.4 | 32702.17 | 122586.1 b | 217331.1 |
| 2015 | 101716 | 2016-01-28 | NA | NA | NA | 474208 | 887331.2 b | 899895.5 | 118552 | 221832.8 b | 224973.9 |
| 2014 | 124521 | 2015-01-16 | NA | NA | NA | 617905.7 | 1301728 b | 936176.4 | 154476.4 | 325432 b | 234044.1 |
| 2013 | 1196387 | 2014-02-21 | NA | NA | NA | 630415.7 | 1385861 b | 974826.7 | 157603.9 | 346465.3 b | 243706.7 |
| 2012 | 532809 | 2013-01-31 | NA | NA | NA | 342290.7 | 1463668 b | 963748.7 | 85572.7 | 365917 b | 240937.2 |
| 2011 | 162051 | 2012-01-26 | NA | NA | NA | 557898.7 | 1641883 b | 986429.7 | 139474.7 | 410470.8 b | 246607.4 |
| 2010 | 332012 | 2011-01-12 | NA | NA | NA | 709809.3 | 1831078 b | 1032228.5 | 177452.3 | 457769.4 b | 258057.1 |
| 2009 | 1179633 | 2010-02-24 | NA | NA | NA | 898708 a | 1835323 b | 2040412.3 | 224677 a | 458830.8 b | 510103.1 |
| 2008 | 617783 | 2009-01-12 | NA | NA | NA | 2178426 a | 1736444 b | 1066779.3 | 544606.5 a | 434111.1 b | 266694.8 |
| 2007 | NA | NA | NA | NA | NA | 3785178 a | 1718334 b | 1096712.3 | 946294.4 a | 429583.6 b | 274178.1 |
| 2006 | 3739069 | 2007-02-15 | NA | NA | NA | 2817358 | 1560333 | 1096712.3 | 704339.5 | 390083.1 | 274178.1 |
| 2005 | 3831286 | 2006-02-10 | NA | NA | NA | 2203218 | 1202933 | 907972.6 | 550804.5 | 300733.1 | 226993.1 |
| 2004 | 881719 | 2005-02-08 | NA | NA | NA | 1638372 | 853614.6 | 683102.3 | 409592.9 | 213403.7 | 170775.6 |
| 2003 | 1896649 | 2004-01-21 | NA | NA | NA | 1966066 | 768591.8 | 666550.9 | 491516.5 | 192148 | 166637.7 |
| 2002 | 2136747 | 2003-02-19 | NA | NA | NA | 1457257 | 585580.5 | 554723.8 | 364314.2 | 146395.1 | 138681.0 |
| 2001 | 1864802 | 2002-02-22 | NA | NA | NA | 841582.3 | 396521.5 | 396521.5 | 210395.6 | 99130.4 | 99130.4 |
| 2000 | 370221 | 2001-01-29 | NA | NA | NA | 371579 | 92894.8 | ||||
| 1999 | 289724 | 2000-01-01 | NA | NA | NA | 294277.3 | 73569.3 | ||||
| 1998 | 454792 | 1999-02-26 | NA | NA | NA | 252725.7 | 63181.4 | ||||
| 1997 | 138316 | 1998-04-27 | NA | NA | NA | 213830.7 | 53457.7 | ||||
| 1996 | 165069 | 1997-02-10 | NA | NA | NA | 178222.3 | 44555.6 | ||||
| 1995 | 338107 | 1995-10-20 | NA | NA | NA | 145378 | 36344.5 | ||||
| 1994 | 31491 | 1995-02-21 | NA | NA | NA | 114728 | 28682 | ||||
| 1993 | 66536 | 1993-10-01 | NA | NA | NA | ||||||
| 1992 | 246157 | 1993-02-09 | NA | NA | NA |
- JPE for 2007 is missing; therefore only 2 years available for calculation.
- JPE for 2007 is missing; therefore only 9 years available for calculation.
Temperature Compliance Point (TCP)
Related SacPAS resource: Sacramento River Water Temperature Threshold Analysis
| Year | March | April | May | June | July | August | September | October | November |
|---|---|---|---|---|---|---|---|---|---|
| 2025 5 | CCR-58°F | CCR-58°F | CCR-58.0°F (01-14); CCR-53.5°F (15-31) |
CCR-53.5°F | CCR-53.5°F | CCR-53.5°F | CCR-53.5°F | CCR-53.5°F | |
| 2024 5 | CCR-53.5°F | CCR-53.5°F | CCR-53.5°F | CCR-53.5°F | CCR-53.5°F | CCR-53.5°F | CCR-53.5°F | CCR-53.5°F | CCR-53.5°F |
| 2023 5 | SAC-54.5°F | SAC-54.5°F | SAC-54.5°F (01-13); CCR-53.5°F (14-31) |
CCR-53.5°F | CCR-53.5°F | CCR-53.5°F | CCR-53.5°F | CCR-53.5°F | CCR-53.5°F |
| 2022 5 | SAC-55°F | SAC-55°F | SAC-55°F (01-01); SAC-58°F (02-31) |
SAC-58°F (01-06); SAC-54.5°F (07-30) |
SAC-54.5°F | SAC-54.5°F | SAC-54.5°F | SAC-54.5°F | SAC-54.5°F |
| 2021 5 | CCR-56°F | CCR-56°F (01-17); CCR-60°F (18-30) |
CCR-60°F (01-16); SAC-57°F (17-31) |
SAC-57°F (01-14); SAC-55°F (15-30) |
SAC-55°F | SAC-55°F | SAC-55°F | SAC-55°F | SAC-55°F |
| 2020 5 | BSF-56°F | BSF-56°F | BSF-56°F | BSF-56°F | BSF-56°F | BSF-56°F | BSF-56°F (01-20); CCR-56°F (21-30) |
CCR-56°F | CCR-56°F |
| 2019 5 | BSF-56°F | BSF-56°F | BSF-56°F | BSF-56°F | BSF-56°F | BSF-56°F | BSF-56°F | BSF-56°F | BSF-56°F |
| 2018 4 | BSF-56°F | BSF-56°F | BSF-56°F | BSF-56°F | BSF-56°F | BSF-56°F | BSF-56°F | BSF-56°F | BSF-56°F |
| 2017 3 | BSF-56°F | BSF-56°F | BSF-56°F | BSF-56°F | BSF-56°F | BSF-56°F | BSF-56°F | BSF-56°F | BSF-56°F |
| 2016 | CCR-58°F | CCR-58°F | CCR-58°F | CCR-58°F
(01-16); BSF-56°F (17-30) |
BSF-56°F | BSF-56°F | BSF-56°F | BSF-56°F | BSF-56°F |
| 2015 2 | CCR-56°F | CCR-56°F (01-17); CCR-58°F (18-30) |
CCR-58°F
(01-14); CCR-56°F (15-31) |
CCR-56°F (01-04); CCR-58°F (05-30) |
CCR-58°F | CCR-58°F | CCR-58°F | CCR-58°F | CCR-58°F |
| 2014 | BSF-56°F (01-27); CCR-58°F (28-31) |
CCR-58°F
(01-24); CCR-56°F (25-30) |
CCR-56°F | CCR-56°F | CCR- 56°F | CCR- 56°F | CCR- 56°F | CCR- 56°F | CCR- 56°F |
| 2013 | BSF-56°F | BSF-56°F | BSF-56°F (01-16); 1BSF-56.75°F (17-31) |
1 BSF-56.75°F | 1 BSF-56.75°F | 1 BSF-56.75°F | 1 BSF-56.75°F | 1 BSF-56.75°F | 1 BSF-56.75°F |
| 2012 | JLF-56°F | JLF-56°F (01-15); BSF-56°F (16-30) |
BSF-56°F | JLF-56°F | JLF-56°F | JLF-56°F | JLF-56°F | BSF-56°F | BSF-56°F |
| 2011 | BSF-56°F | BSF-56°F | BSF-56°F | JLF-56°F | JLF-56°F | JLF-56°F | JLF-56°F | JLF-56°F | JLF-56°F |
| 2010 | BSF-56°F | BSF-56°F (01-14); JLF-56°F (15-30) |
JLF-56°F (01-10); BSF-56°F (11-24); JLF-56°F (25-31) |
JLF-56°F | JLF-56°F | JLF-56°F | JLF-56°F | JLF-56°F | JLF-56°F |
- BSF-56.75°F used as surrogate for Airport Road 56°F
- Year 2015 July - November the temperature target was 57°F, not to exceed 58°F
- Year 2017 pilot evaluation study also targeted CCR at 53°F May 15 - Oct 31
- Year 2018 pilot evaluation study also targeted CCR at 53.5°F May 15 - Oct 31
- Years 2018-2025 compiled by SacPAS from annual "Northern CVP Water Temperature Report" (for individual years 2018-2025), https://www.usbr.gov/mp/cvo/vungvari/sactemprpt.pdf
Extinction Risk
Direct quote from NMFS 2024, p17.
Updated Biological Risk Summary
The biological status of the SR winter-run Chinook salmon population has declined since the 2016 5-year review, with the single spawning population on the mainstem Sacramento River at a high risk of extinction (Table 7). New information indicates the population – which had experienced a declining trend in abundance through 2017 – is beginning to rebuild such that the population decline viability criteria would indicate a low risk of extinction for SR winter-run Chinook salmon. The population, however, remains at an increased risk of extinction due to the influence of the hatchery broodstock. Although at the time of this review hatchery influence is declining, it remains at a level above which would indicate a low or moderate extinction risk.
| Criteria | 2011 5-Year Review | 2016 5-Year Review | 2024 5-Year Review |
|---|---|---|---|
| Population Size | Low risk | Low risk | Low risk |
| Population Decline | Low risk | Moderate risk | Low risk |
| Catastrophe, rate and effect | Low risk | Low risk | Low risk |
| Hatchery Influence | Low risk | Moderate risk | High risk |
| 2011 5-Year Review | 2016 5-Year Review | 2024 5-Year Review | |
|---|---|---|---|
| Extinction Risk | Low risk | Moderate risk | High risk |
Outyear Adult Escapement Forecast
Annual updates to Adult Escapement Forecast estimates available February/March.
Related SacPAS resource: SacPAS webpage for PFMC Abundance, Harvest, and Impact Rates
| Year a | 3-Year Geometric Mean b | Abundance Forecast c | Postseason Abundance d | Postseason Abundance Value Footnote | Age-3 impact rate south of Point Arena, CA | |||
|---|---|---|---|---|---|---|---|---|
| Maximum Allowable (%) e | Preseason Forecast (%) | Postseason Estimate (%) | Postseason Estimate Value Footnote | |||||
| 2026 i | 9883 | f | 20.0 | NA | NA | |||
| 2025 | 4507 | f | 20.0 | 1.6 | NA | |||
| 2024 | 1013 | f | 12.1 | — | — | |||
| 2023 | 4540 | f | 20.0 | 0.0 | NA | h | ||
| 2022 | 5971 | 3071 | 20.0 | 15.2 | 26.2 | g | ||
| 2021 | 9063 | 6346 | 20.0 | 14.7 | 18.8 | |||
| 2020 | 3077 | 10854 | 20.0 | 16.2 | 12.6 | |||
| 2019 | 1924 | 6935 | 15.7 | 14.8 | 10.0 | |||
| 2018 | 1594 | 8139 | 14.4 | 8.5 | 13.9 | |||
| 2017 | 2521 | 2117 | 15.8 | 12.2 | 17.6 | |||
| 2016 | 3981 | 508 | 19.9 | 12.8 | 10.7 | |||
| 2015 | 3659 | 867 | 19.0 | 17.5 | e | |||
| 2014 | 2380 | 3718 | 15.4 | 15.4 | 15.8 | |||
| 2013 | 1521 | 3067 | 12.9 | 12.9 | 18.8 | |||
| 2012 | 1797 | 5960 | 13.7 | 13.7 | 12.6 | |||
| 2011 | 3263 | 28.3 | ||||||
| 2010 | 696 | e | ||||||
| 2009 | 1439 | 0.0 | ||||||
| 2008 | 4152 | 0.0 | ||||||
| 2007 | 2954 | 17.8 | ||||||
| 2006 | 2619 | 15.1 | ||||||
| 2005 | 18907 | 17.2 | ||||||
| 2004 | 18090 | 24.8 | ||||||
| 2003 | 5976 | 10.3 | ||||||
| 2002 | 9092 | 21.8 | ||||||
| 2001 | 8508 | 23.3 | ||||||
| 2000 | 21.4 | |||||||
- Table II-2 Footnotes
- a/ Year indicates the management year in which age-3 SRWC are exposed to ocean fisheries.
- b/ Allowable impact rates from 2012-2017 were determined by an abundance-based control rule, where abundance was defined as the most recent three-year geometric mean of escapement.
- c/ Since 2018 the abundance forecast has been defined as the predicted age-3 escapement in the absence of fisheries. Forecasts were made using a life cycle model through 2023. Beginning in 2024, forecasts were made using a Gaussian Process model.
- d/ Postseason estimates of the age-3 escapement in the absence of fisheries.
- e/ Beginning in 2018, allowable impact rates were determined by a new control rule utilizing forecasts of the age-3 escapement in the absence of fisheries.
- f/ Insufficient data for postseason estimate.
- g/ Preliminary. Incomplete cohort data (age-4 escapement unavailable).
- h/ Not estimated. Incomplete cohort data (age-3 and age-4 escapement unavailable).
- i/ Year 2026 is Preliminary.
PA 3.3.3 Quoted Text
Annual Winter-run Chinook Salmon Broodyear Assessment
Direct quote from Reclamation 2024, pp 3-25 to 3-26.
3.3.3 Annual Winter-run Chinook Salmon Broodyear Assessment
In order to inform operations, risk tradeoffs for determining the downstream extent of water temperature management, and the need to pursue increasing production or taking other actions at LSNFH, the JPE SubTeam will conduct a winter-run Chinook salmon broodyear assessment for the previous year's cohort and the cohort of return adults that hatched three years prior. The purpose is to track species conditions and take appropriate actions to avoid adverse impacts to the following year’s cohort. If the previous year’s cohort and the cohort three years prior, is determined to have experienced "adverse conditions", then more actions would be taken to manage the objectives for each Bin, including both biological and drought protection objectives. The broodyear assessment will be developed by February 1 or each year using the best available science to guide calculation of each metric described below. The broodyear assessment will be based on the best available science each year and the JPE SubTeam may consider using the following indicators or information:
- >30% TDM
- <20% ETF survival
- 25% of historic JPE
- TMP compliance point was above CCR
- Adverse Population Viability Trends (per previous year’s annual brood year report if there was an increase in any of the five criteria in Lindley et. al. 2007)
- High Risk of Extinction (per 5 year status review)
- Outyear adult escapement forecast based on Pacific Fishery Management Council winter-run stock abundance analyses
The JPE SubTeam will provide the broodyear assessment to Reclamation and the SHOT. If the broodyear assessment determines Adverse Conditions for Winter-run Chinook salmon and identifies that Shasta storage and hydrology are expected to result in continuing adverse conditions to the coming broodyear, the SHOT will report these conditions and proposed actions to the Directors and all reasonable actions will be taken to avoid continued adverse conditions. These indicators of broodyear strength can be revised by the SHOT with NMFS approval.
Extinction Risk and Population Metrics Definitions
Direct quote from Lindley et al. 2007, Table 1.
| Criterion | Risk of Extinction | ||
|---|---|---|---|
| High | Moderate | Low | |
| Extinction risk from PVA | > 20% within 20 years – or any ONE of – |
> 5% within 100 years – or any ONE of – |
< 5% within 100 years – or ALL of – |
| Population sizea | Ne ≤ 50 –or– N ≤ 250 |
50 < Ne ≤ 500 –or– 250 < N ≤ 2500 |
Ne > 500 –or– N > 2500 |
| Population decline | Precipitous declineb | Chronic decline or depressionc | No decline apparent or probable |
| Catastrophe, rate and effectd | Order of magnitude decline within one generation | Smaller but significant declinee | not apparent |
| Hatchery influencef | High | Moderate | Low |
- Census size N can be used if direct estimates of effective size Ne are not available, assuming Ne/N = 0.2.
- Decline within last two generations to annual run size ≤ 500 spawners, or run size > 500 but declining at ≥ 10% per year. Historically small but stable population not included.
- Run size has declined to ≤ 500, but now stable.
- Catastrophes occurring within the last 10 years.
- Decline < 90% but biologically significant.
- See Figure 1 (Lindley et al. 2007) for assessing hatchery impacts.
Direct quote from Lindley et al. 2007, Table 2.
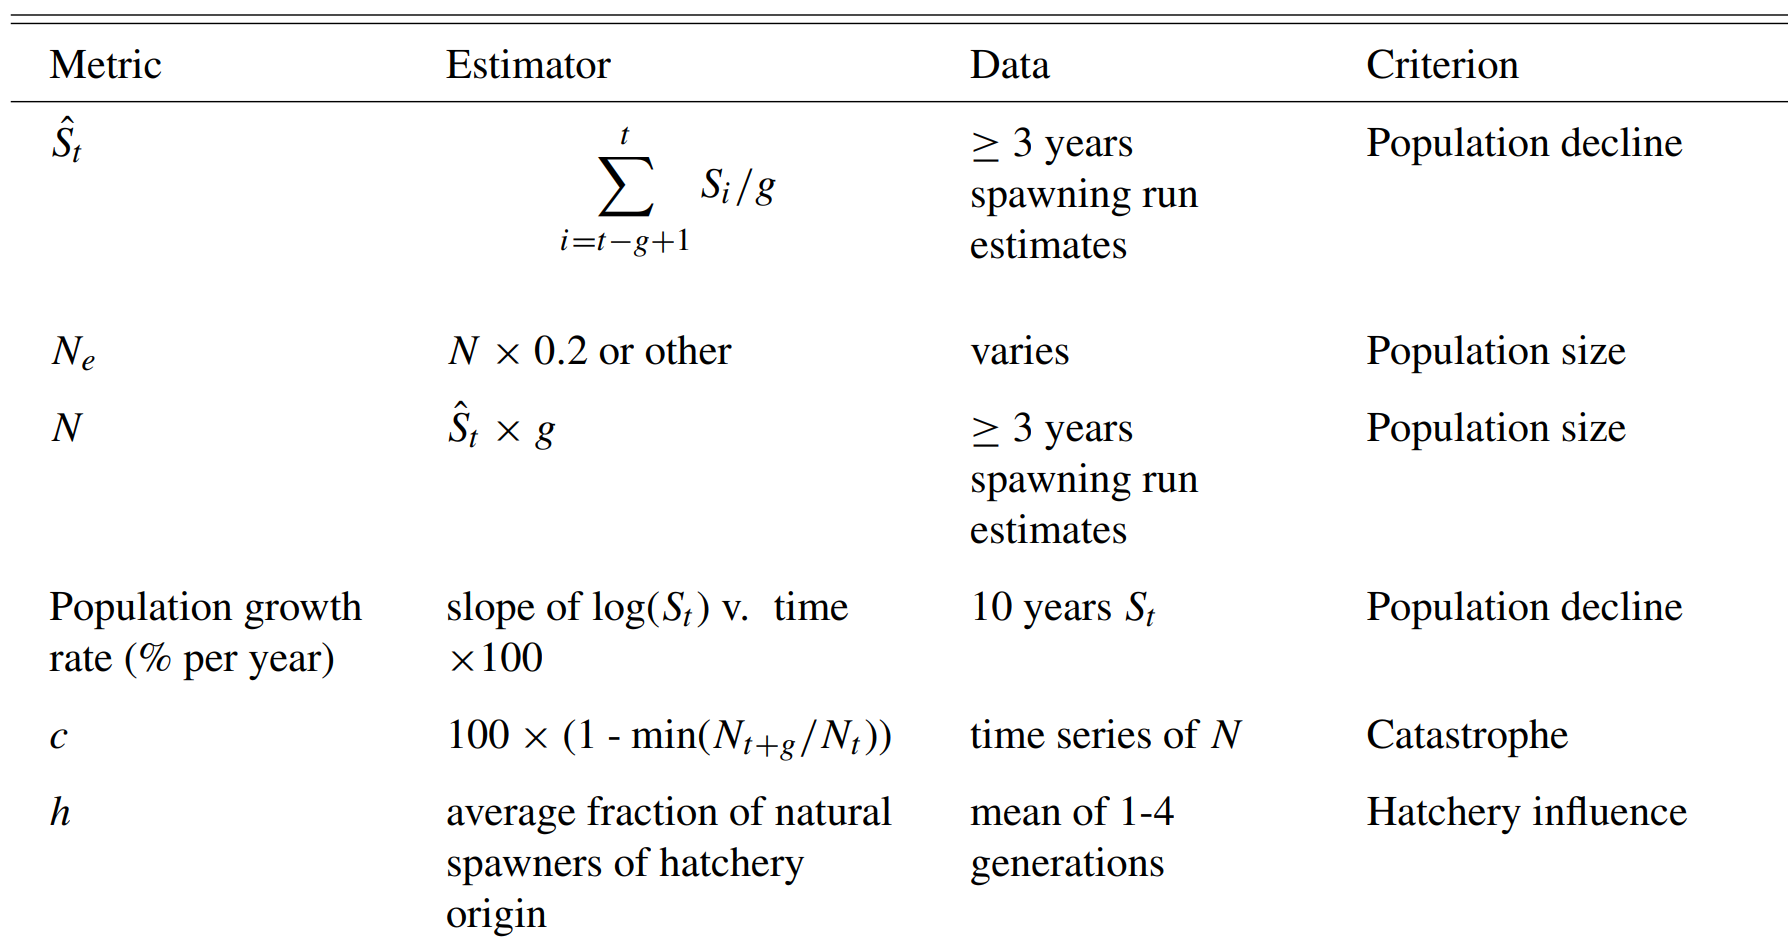
Table 2. Estimation methods and data requirements for population metrics. St denotes the number of spawners in year t; g is mean generation time, which we take as three years for California salmon.
References
Allendorf, F.W. et al. 1997. Prioritizing Pacific salmon stocks for conservation. Conservation Biology 11(1):140–152.
Anderson, J.J., W.N. Beer, J.A. Israel, S. Greene. 2022. Targeting River Operations to the Critical Thermal Window of Fish Incubation: Model and Case Study on Sacramento River Winter-Run Chinook Salmon. River Research and Applications 8950: 895-905.
Lindley, S.T. et al. 2007. Framework for Assessing Viability of Threatened and Endangered Chinook Salmon and Steelhead in The Sacramento-San Joaquin Basin. Vol. 5, Issue 1 [February 2007]. Article 4.
Martin, B.T., A. Pike, S.N. John, N. Hamda, J. Roberts, S.T. Lindley, and E.M. Danner. 2017. Phenomenological vs. Biophysical Models of Thermal Stress in Aquatic Eggs. Ecology Letters 20(1):50-59.
NMFS (National Marine Fiseries Service). 2024. 2024 5-Year Review: Summary & Evaluation of Sacramento River Winter-Run Chinook Salmon. West Coast Region, National Marine Fiseries Service.
PFMC (Pacific Fishery Management Council). 2025a. Preseason Report I: Stock Abundance Analysis and Environmental Assessment Part 1 for 2025 Ocean Salmon Fishery Regulations. (Document prepared for the Council and its advisory entities.) Pacific Fishery Management Council, 7700 NE Ambassador Place, Suite 101, Portland, Oregon 97220-1384.
Reclamation 2024. Long-Term Operation of the Central Valley Project and State Water Project Central Valley Project, California Mid-Pacific Region, Final EIS - Appendix AB - Biological Assessment - Chapter 3 Proposed Actions. pp 3-25, 3-26.