

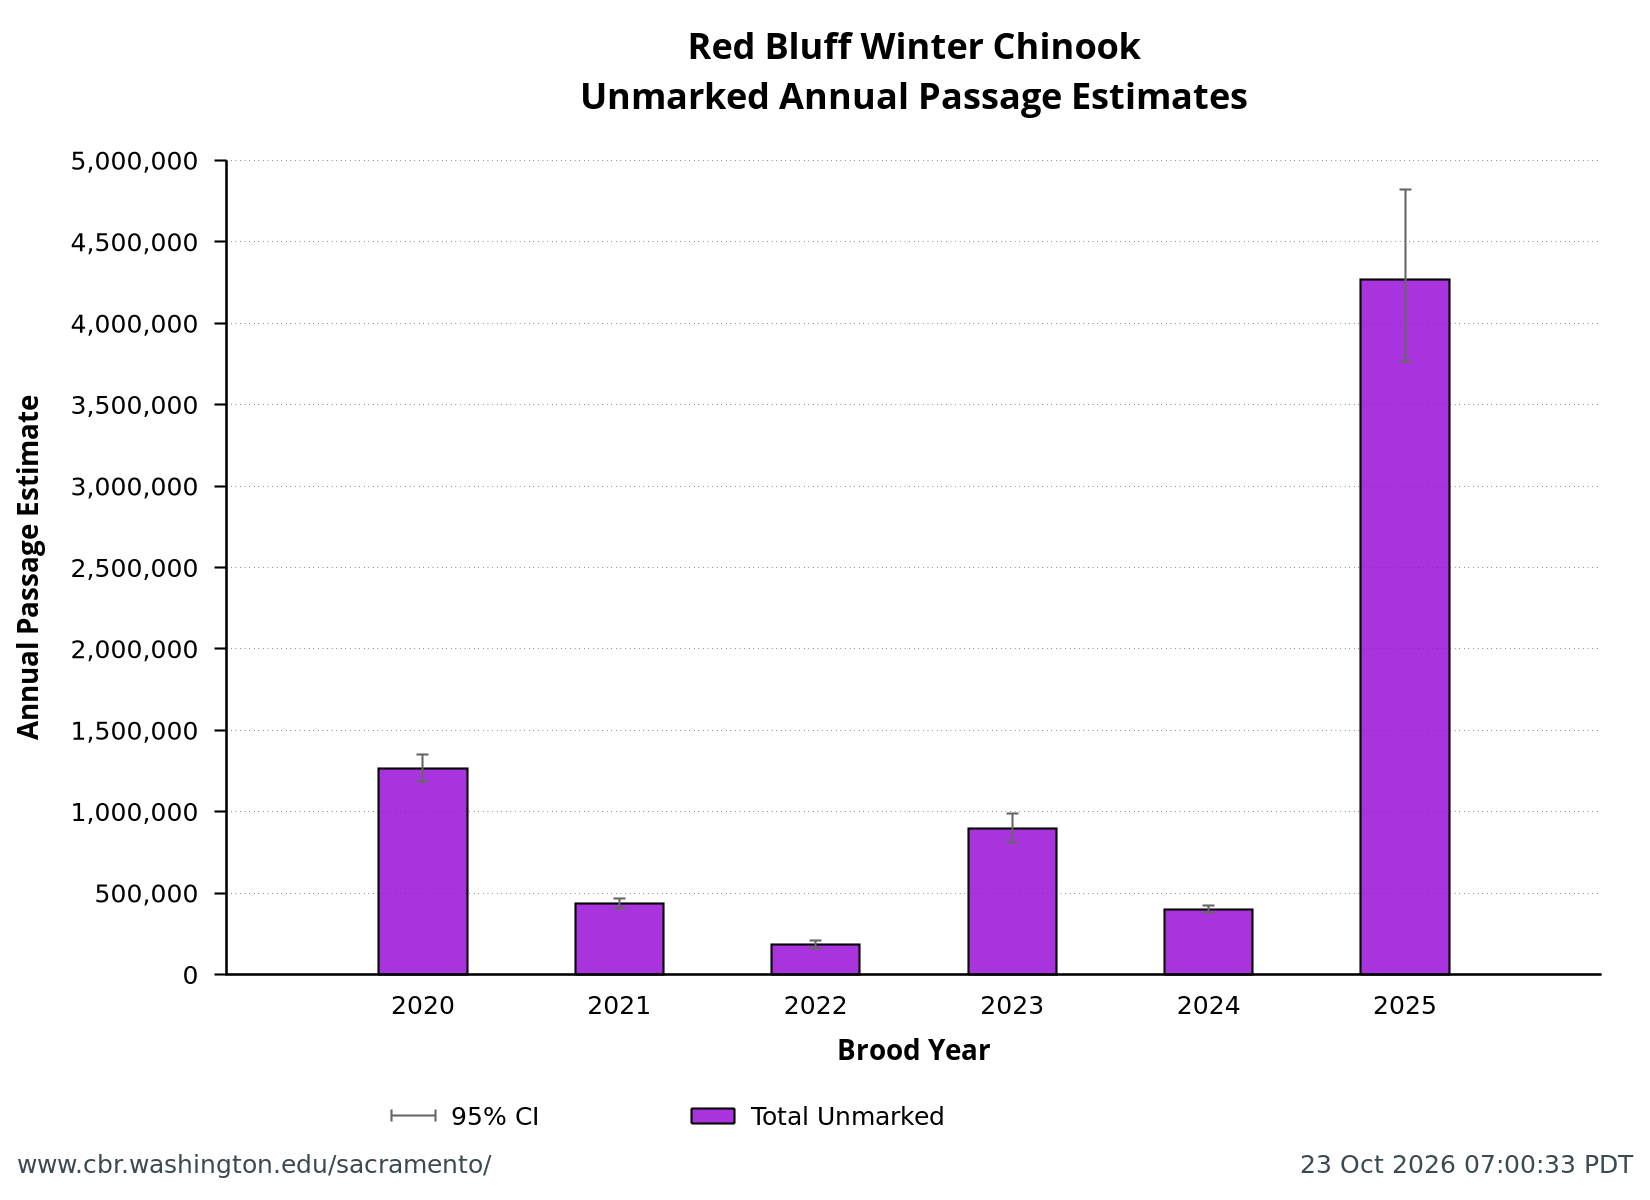
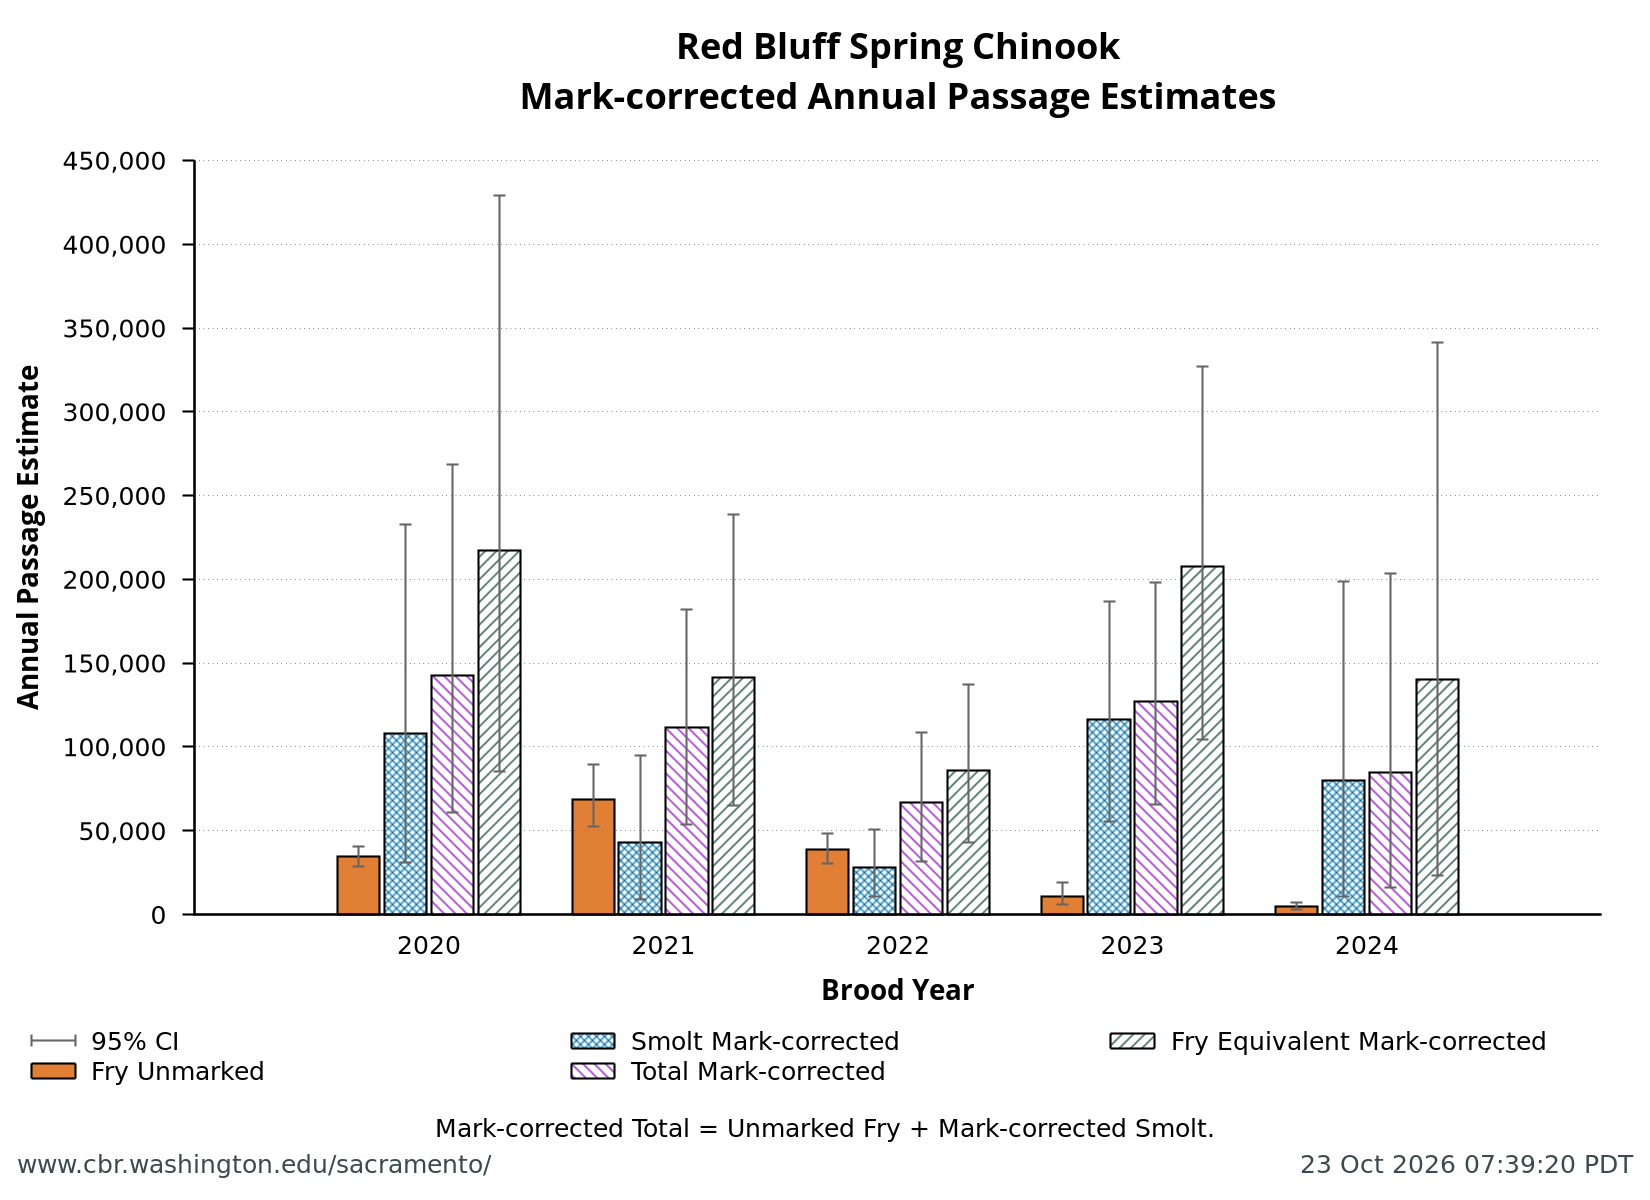
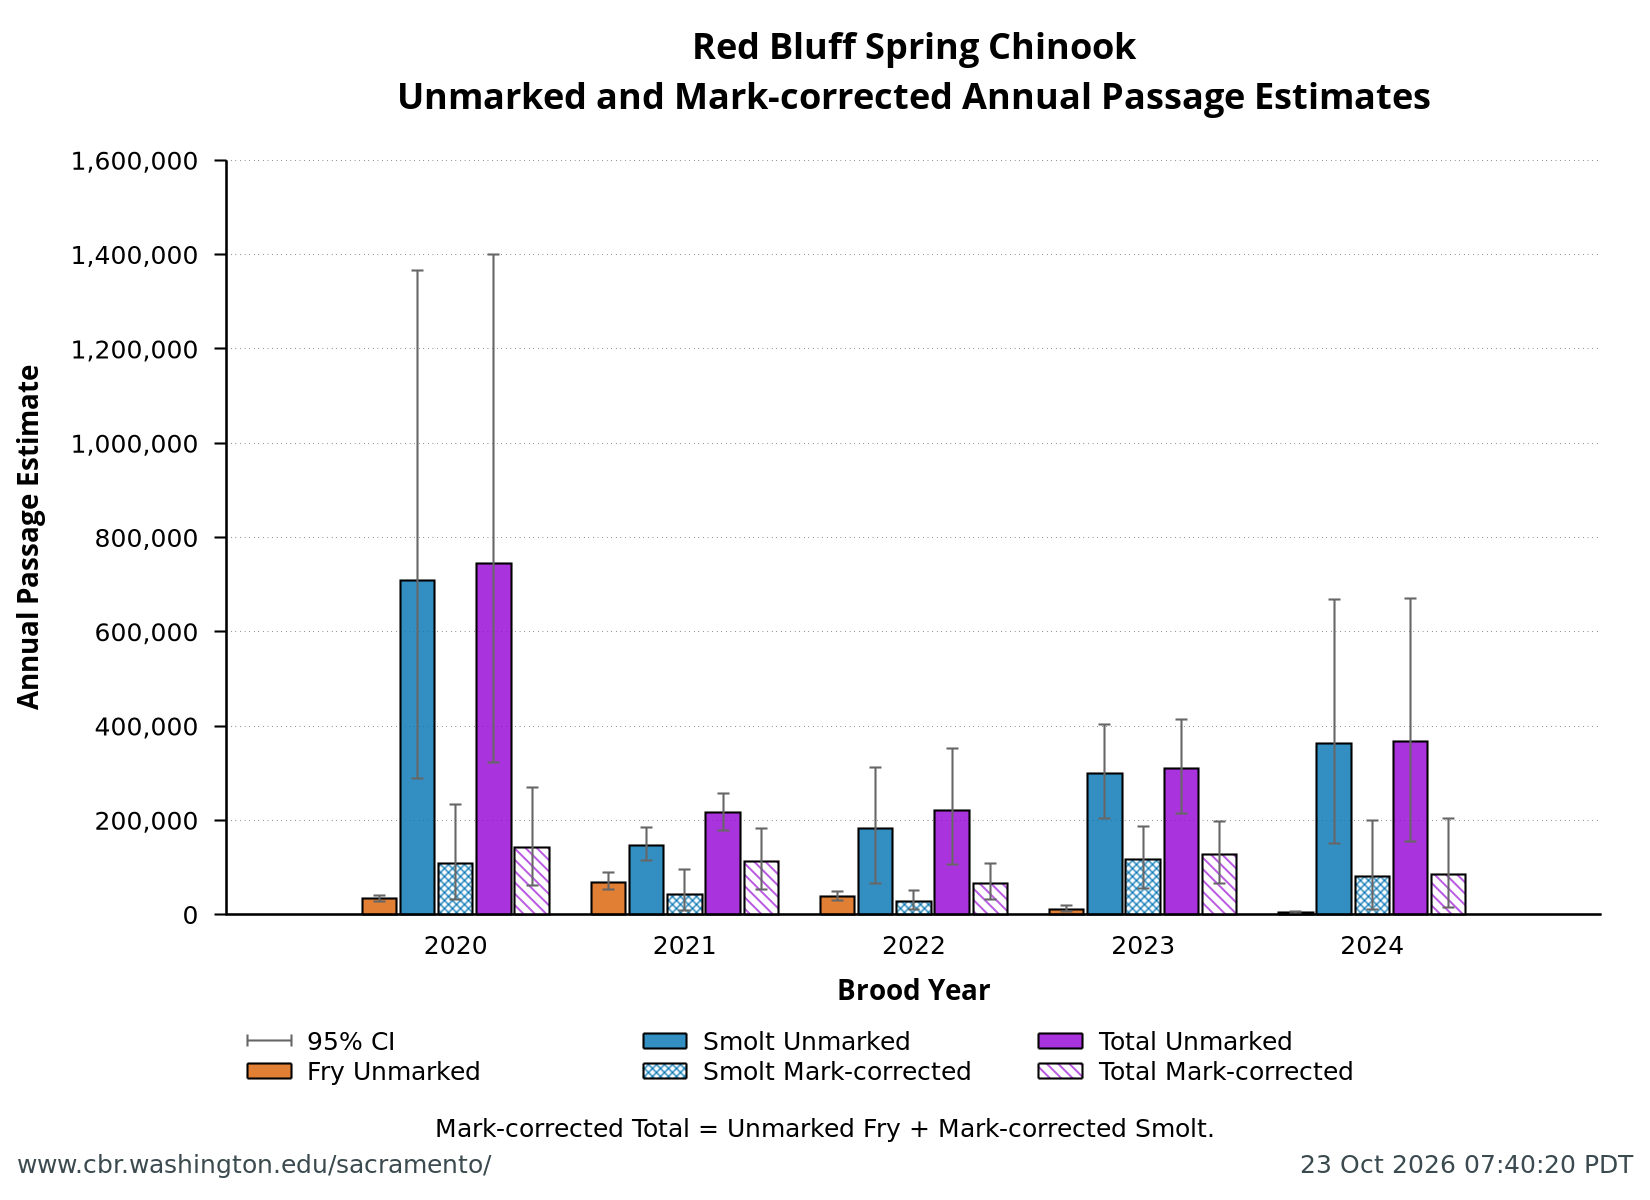
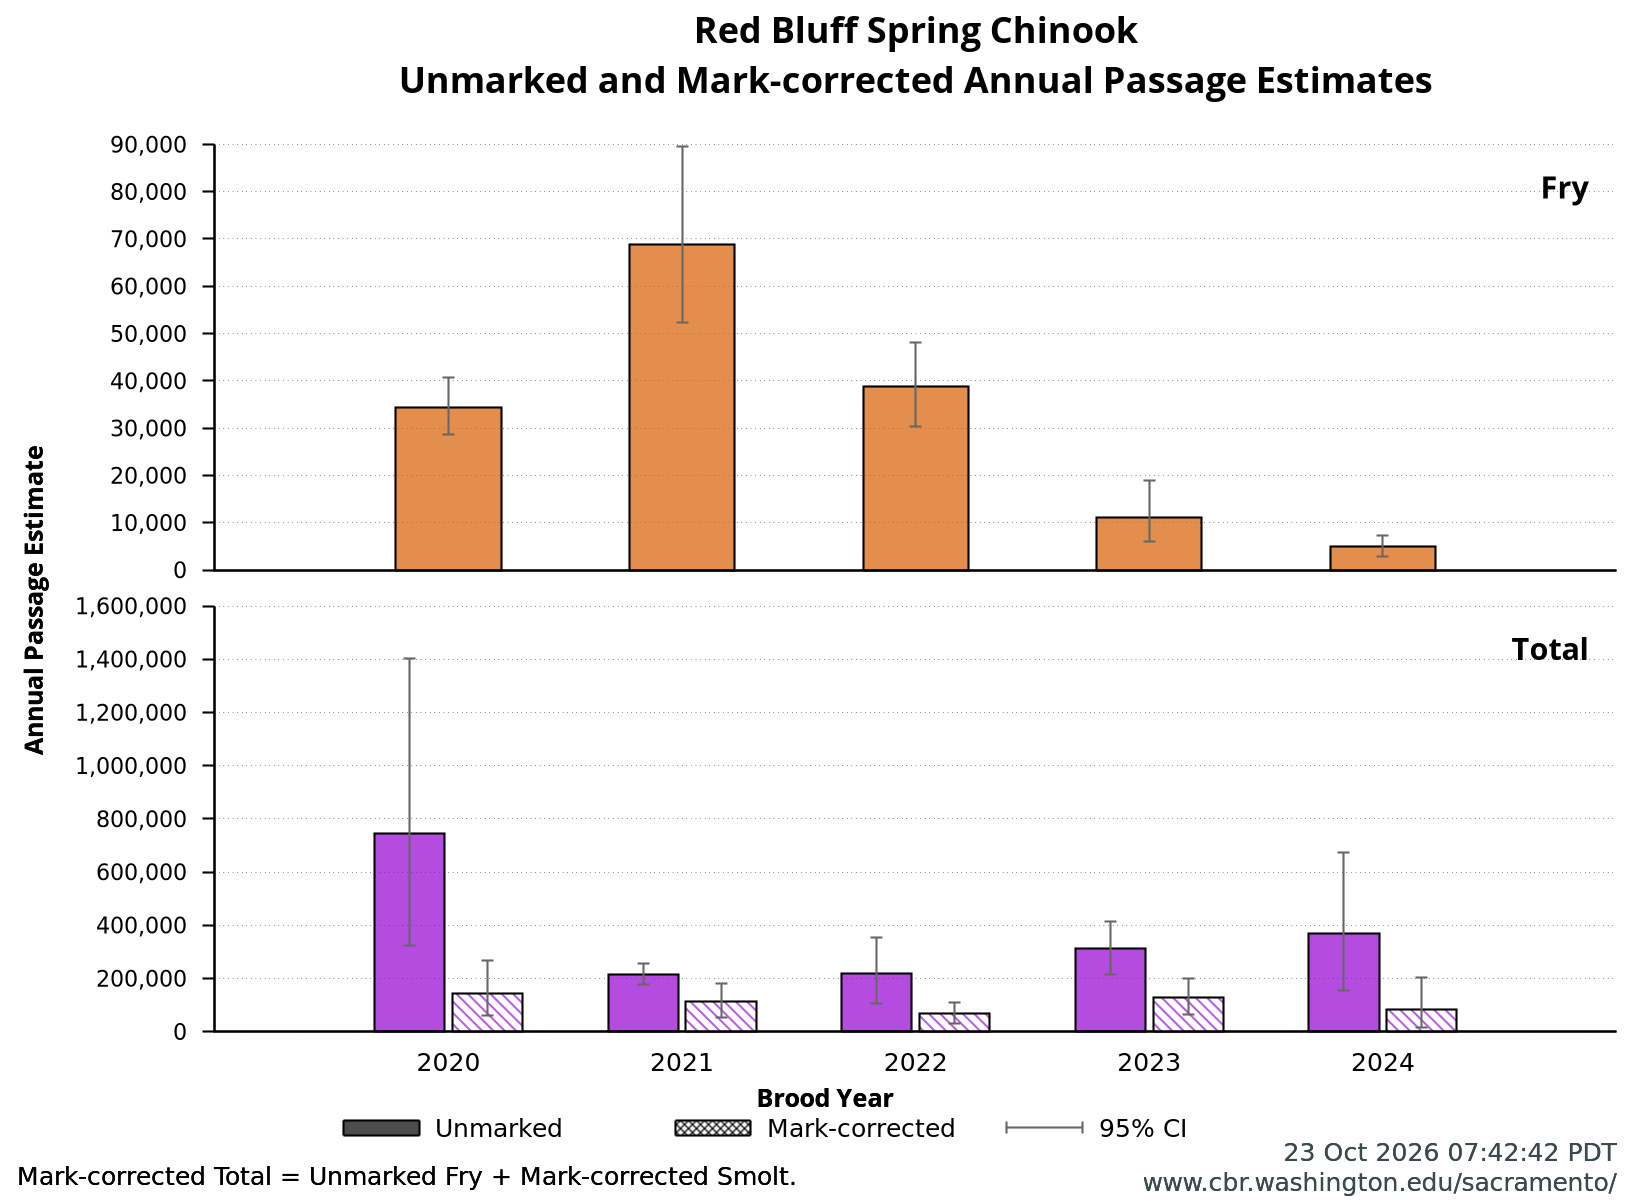
Red Bluff Juvenile Estimates Annual Graph
Data Courtesy of USFWS, Red Bluff
Query Notes
- Juvenile Monitoring and Sampling Metadata
- Red Bluff Juvenile Estimates are also included in:
- Cohort Juvenile Monitoring with current and historical passage and sampling at Red Bluff and downstream locations (figures and table)
- Cohort Migration Timing with Density and Environmental Conditions (figures and table)
- Current Catch with current and historical migration timing at Red Bluff and downstream locations (figures)
- Juvenile Salmonid Monitoring with current year passage and environmental conditions at Red Bluff and downstream locations (figures)
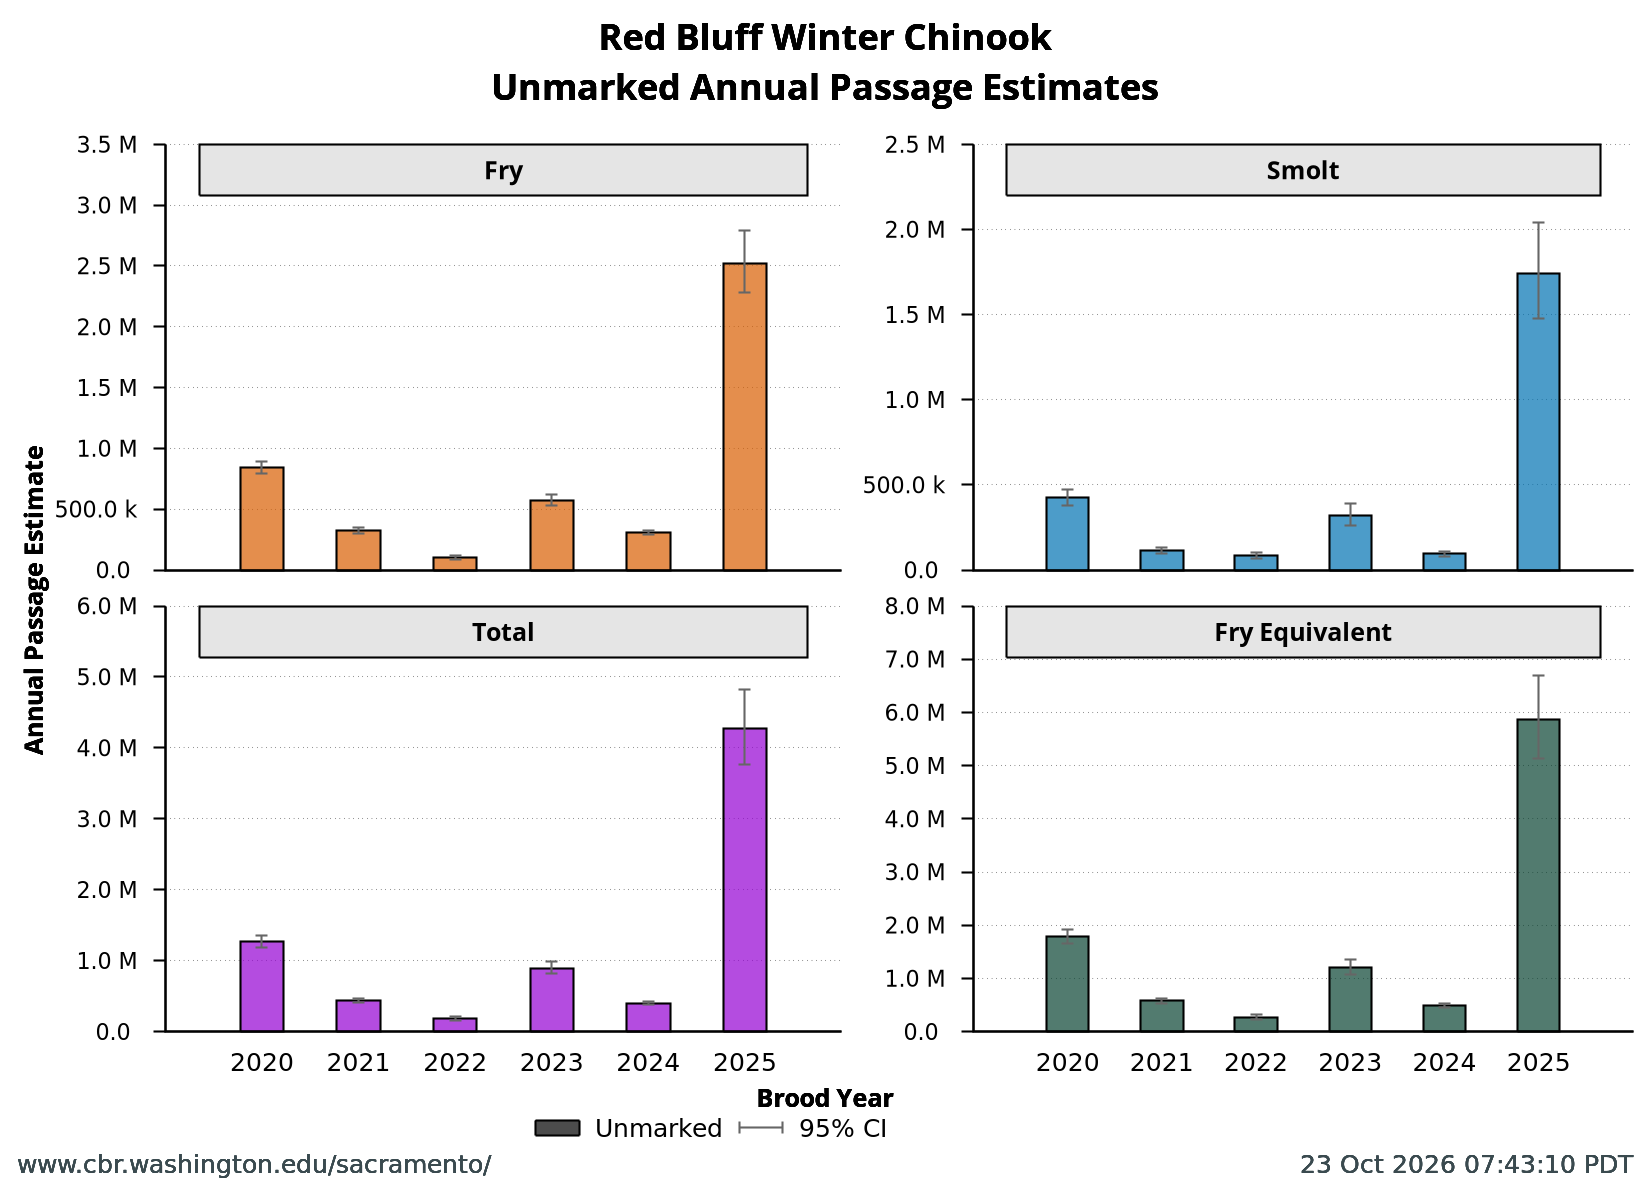
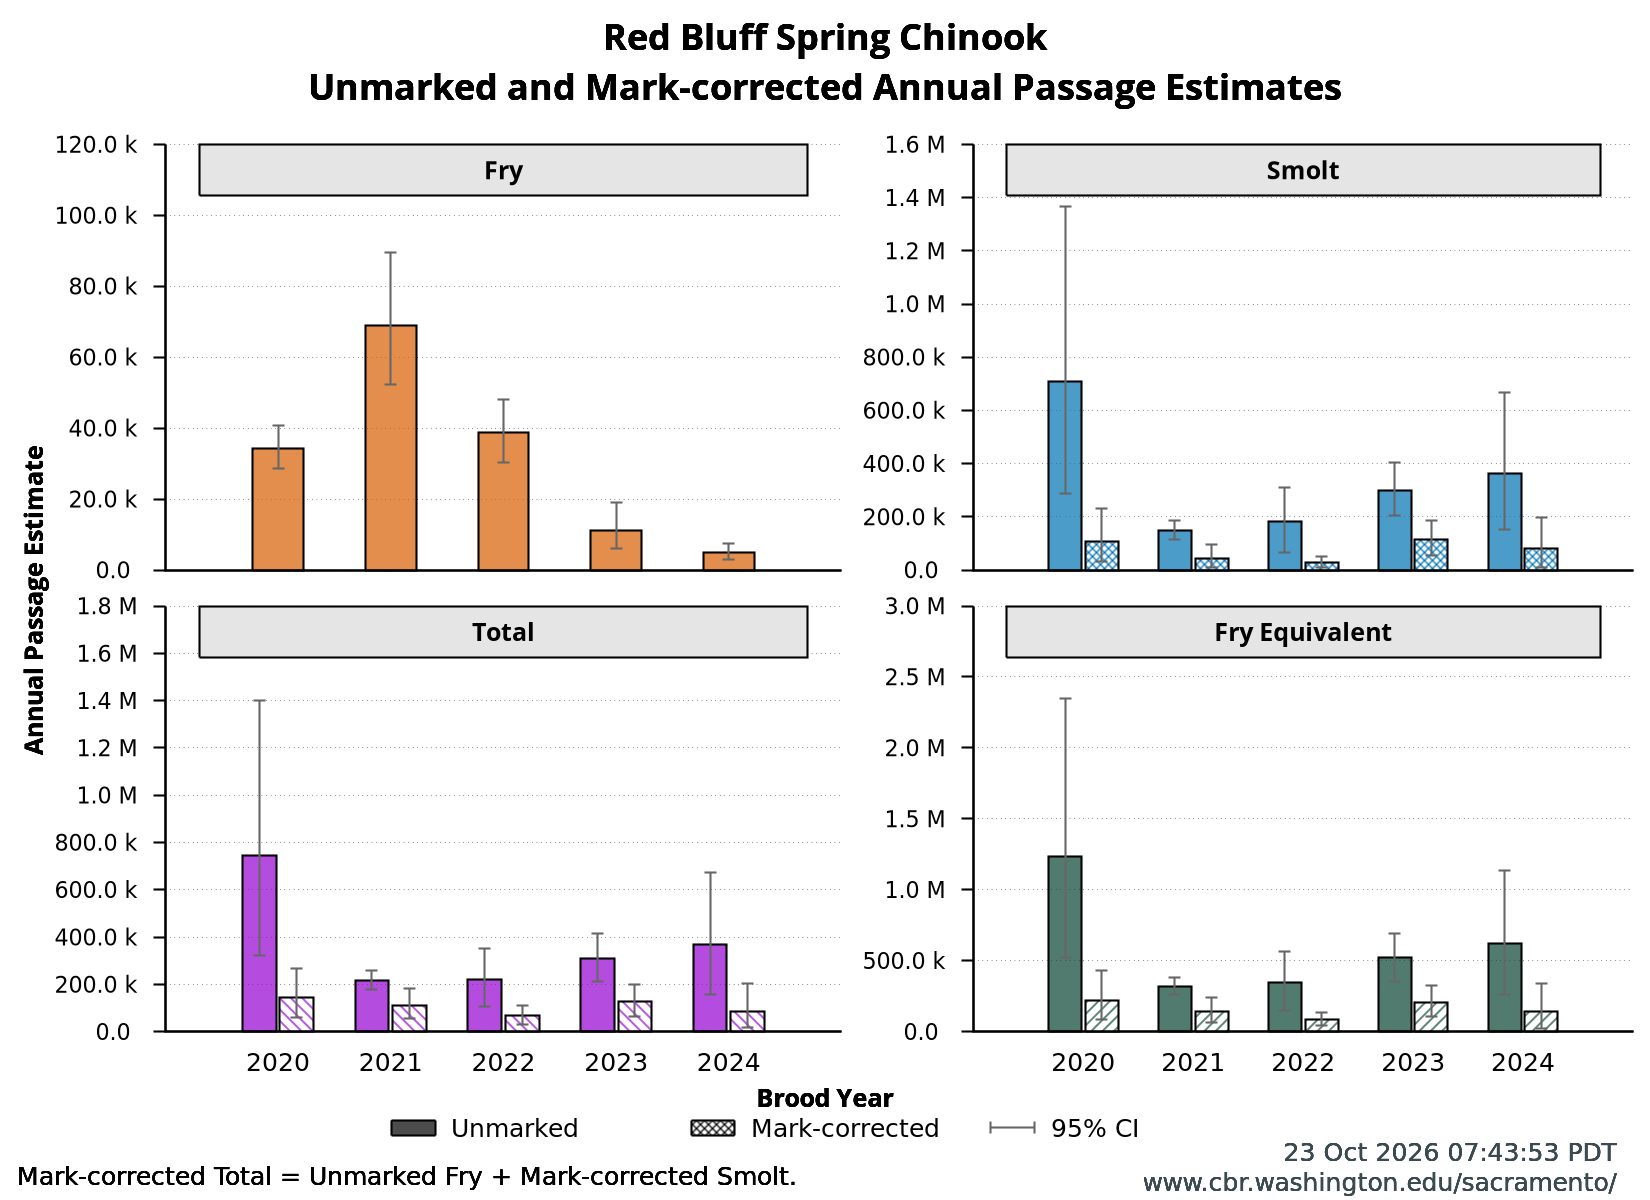
- 2025-10-31: USFWS updated the juvenile passage estimates method for Red Bluff. Passage estimates for BY2020 through BY2024 have been fully revised. More information is available on Juvenile Monitoring and Sampling Metadata page.
- Mark-corrected estimates (genetic corrections and subtraction of unmarked hatchery smolts) are not available for current brood years; the estimates are distributed by USFWS with prior brood year annual estimates.
- Fry Equivalent estimates are not available for current brood years; the estimates are distributed by USFWS with prior brood year annual estimates.
Example Output Plots
Latest Monitoring Dates in SacPAS Database
- Upper Clear Creek RST: 2026-06-15
- Lower Clear Creek RST: 2026-06-26
- Upper Battle Creek RST: 2026-10-09
- Red Bluff Diversion Dam RST: 2026-11-11
- Tisdale Weir RST: 2026-11-08
- Knights Landing RST: 2026-11-13
- Lower Feather River RST: 2026-05-11
- Lower Sacramento River RST: 2026-11-08
- Lower American River RST: 2025-06-20
- Sacramento Trawls (@ Sherwood Harbor): 2026-11-13
- Sacramento Beach Seines: 2026-11-13
- Chipps Island Trawls: 2026-11-13
- Mossdale Trawls: 2026-11-13
- Caswell Memorial State Park RSTs: 2026-05-27
- Enhanced Delta Smelt Monitoring: 2026-11-13
- SWP & CVP Non-Clipped Older Juvenile Chinook Loss: 2026-03-26
- SWP & CVP Non-Clipped Fry/Smolt Chinook Loss: 2026-06-08
- SWP & CVP Non-Clipped Steelhead Loss: 2026-05-21
- SWP & CVP Clipped Loss: 2026-05-21
- SWP & CVP Exports: 2026-11-12