Winter Chinook:
Juveniles in River
Migration Timing — annual data


Today Percent
| Species | Red Bluff Diversion Dam | Tisdale RST | Knights Landing RST | Sac Trawl (Sherwood) Catch Index | Chipps Island Trawl Catch Index | Salvage |
|---|---|---|---|---|---|---|
| Chinook, LAD Winter-run, Unclipped | 100.0% (100.0%,100.0%) BY: 2015 - 2024 |
100.0% (100.0%,100.0%) BY: 2015 - 2024 |
100.0% (100.0%,100.0%) BY: 2015 - 2024 |
100.0% (100.0%,100.0%) BY: 2015 - 2024 |
100.0% (100.0%,100.0%) BY: 2015 - 2024 |
100.0% (100.0%,100.0%) WY: 2016 - 2025 |
Calculations generated by SacPAS Migration Timing and Conditions by Cohort and Salvage Timing. Data Courtesy of USFWS, Red Bluff; CDFW via StreamNet and CDEC; USFWS, Lodi.
Current Catch

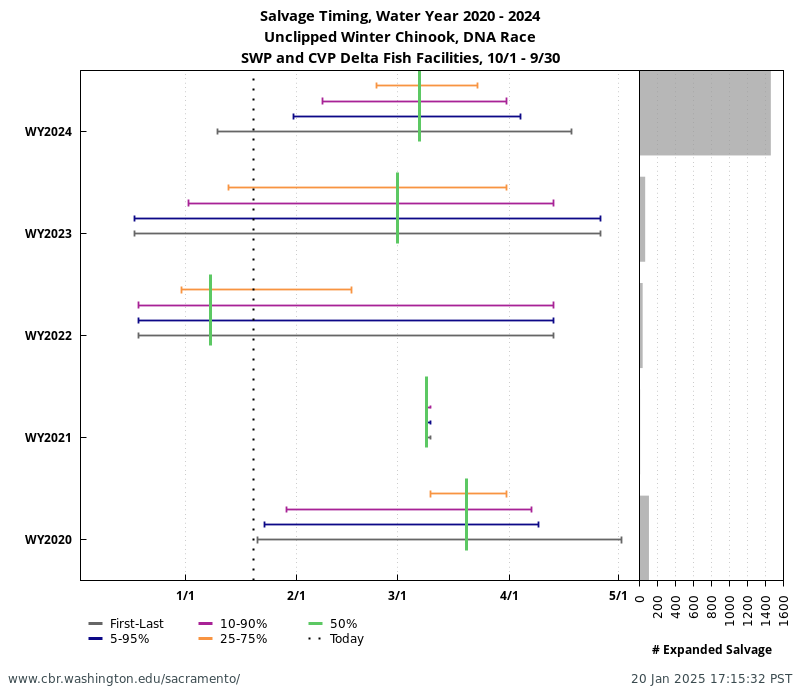
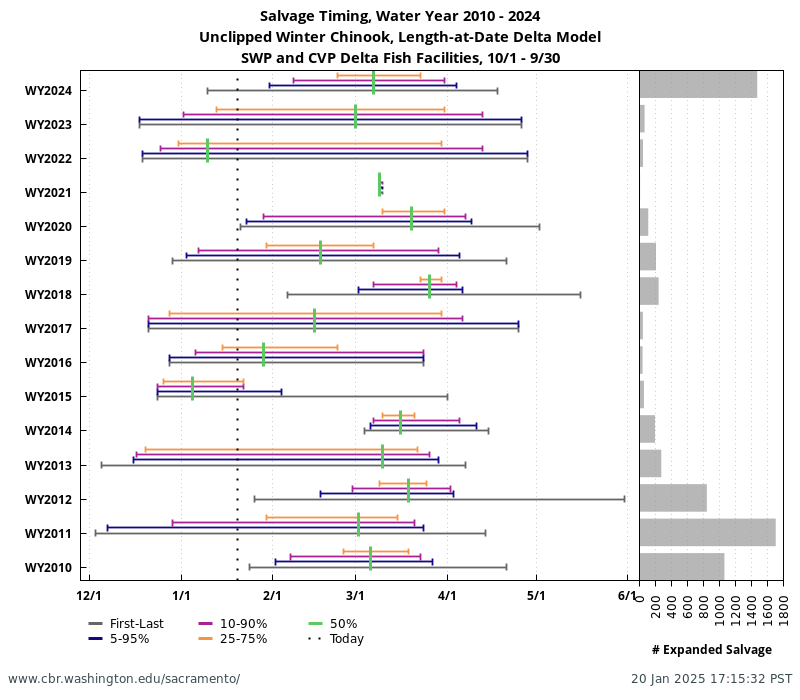
Juveniles in Delta
Salvage Timing — annual data
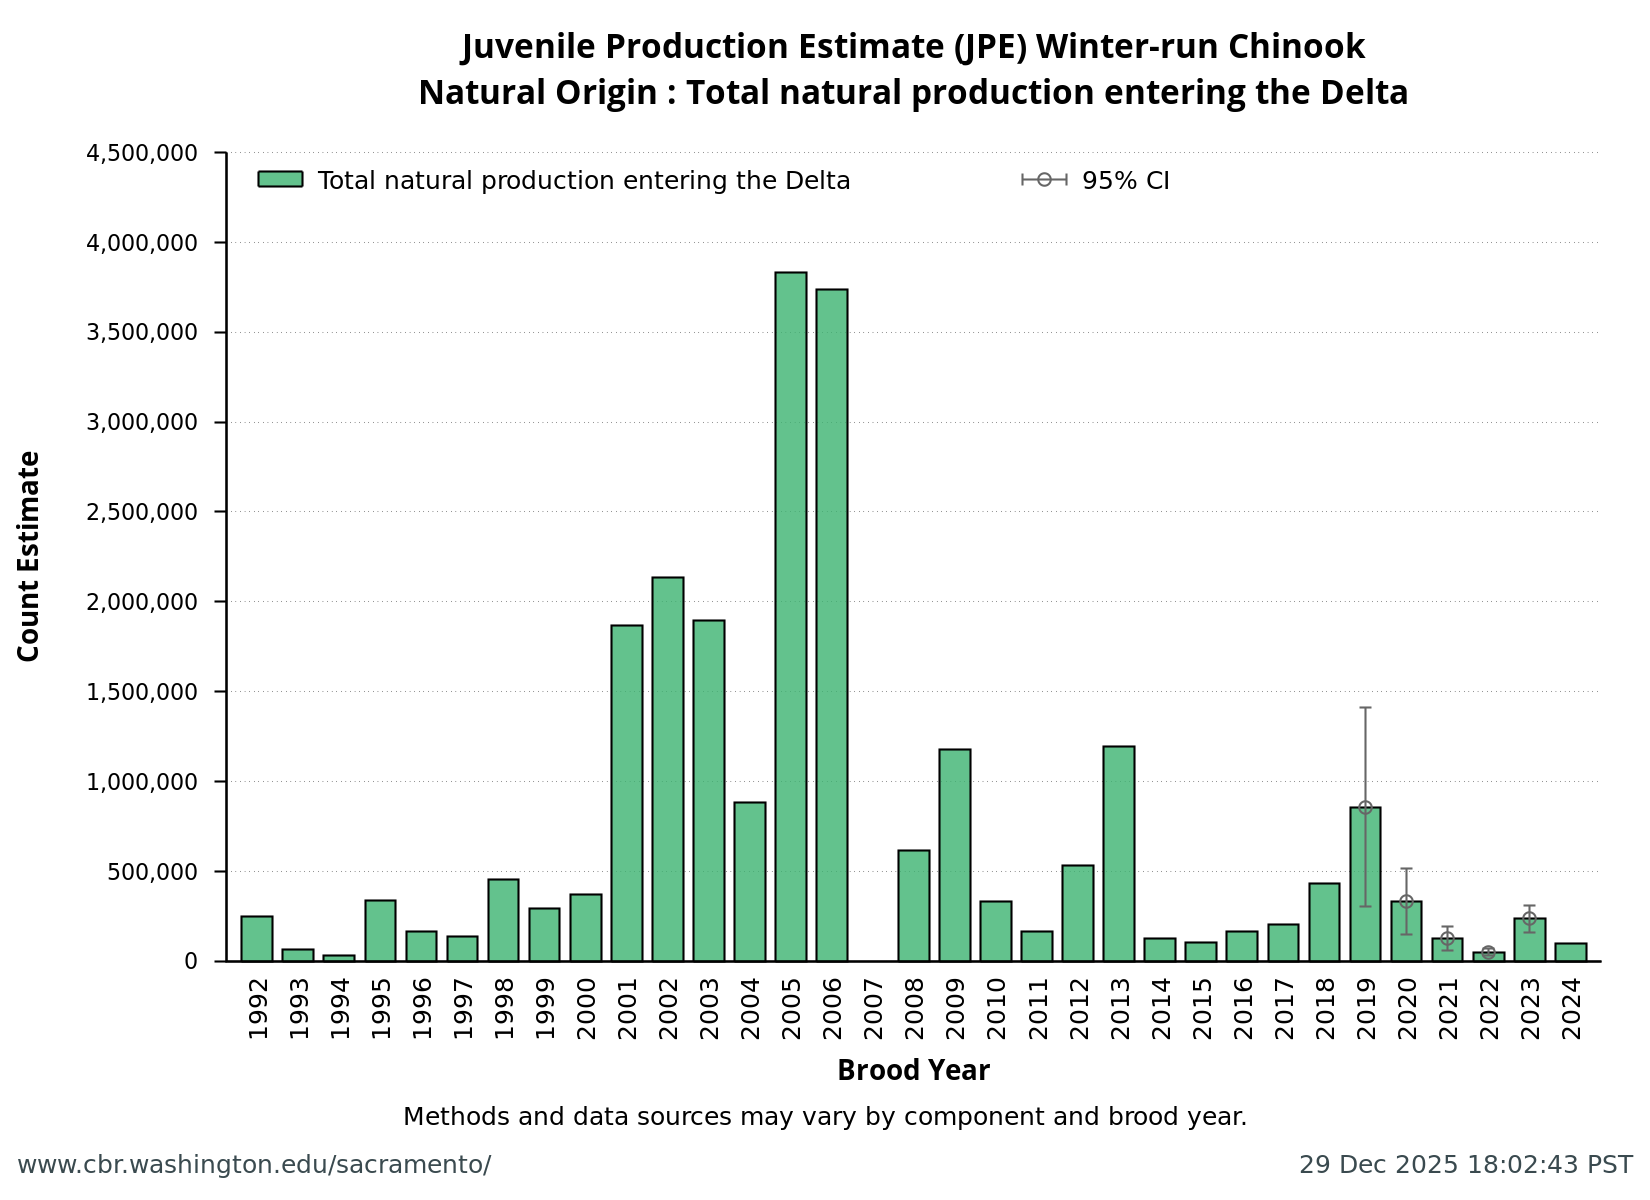
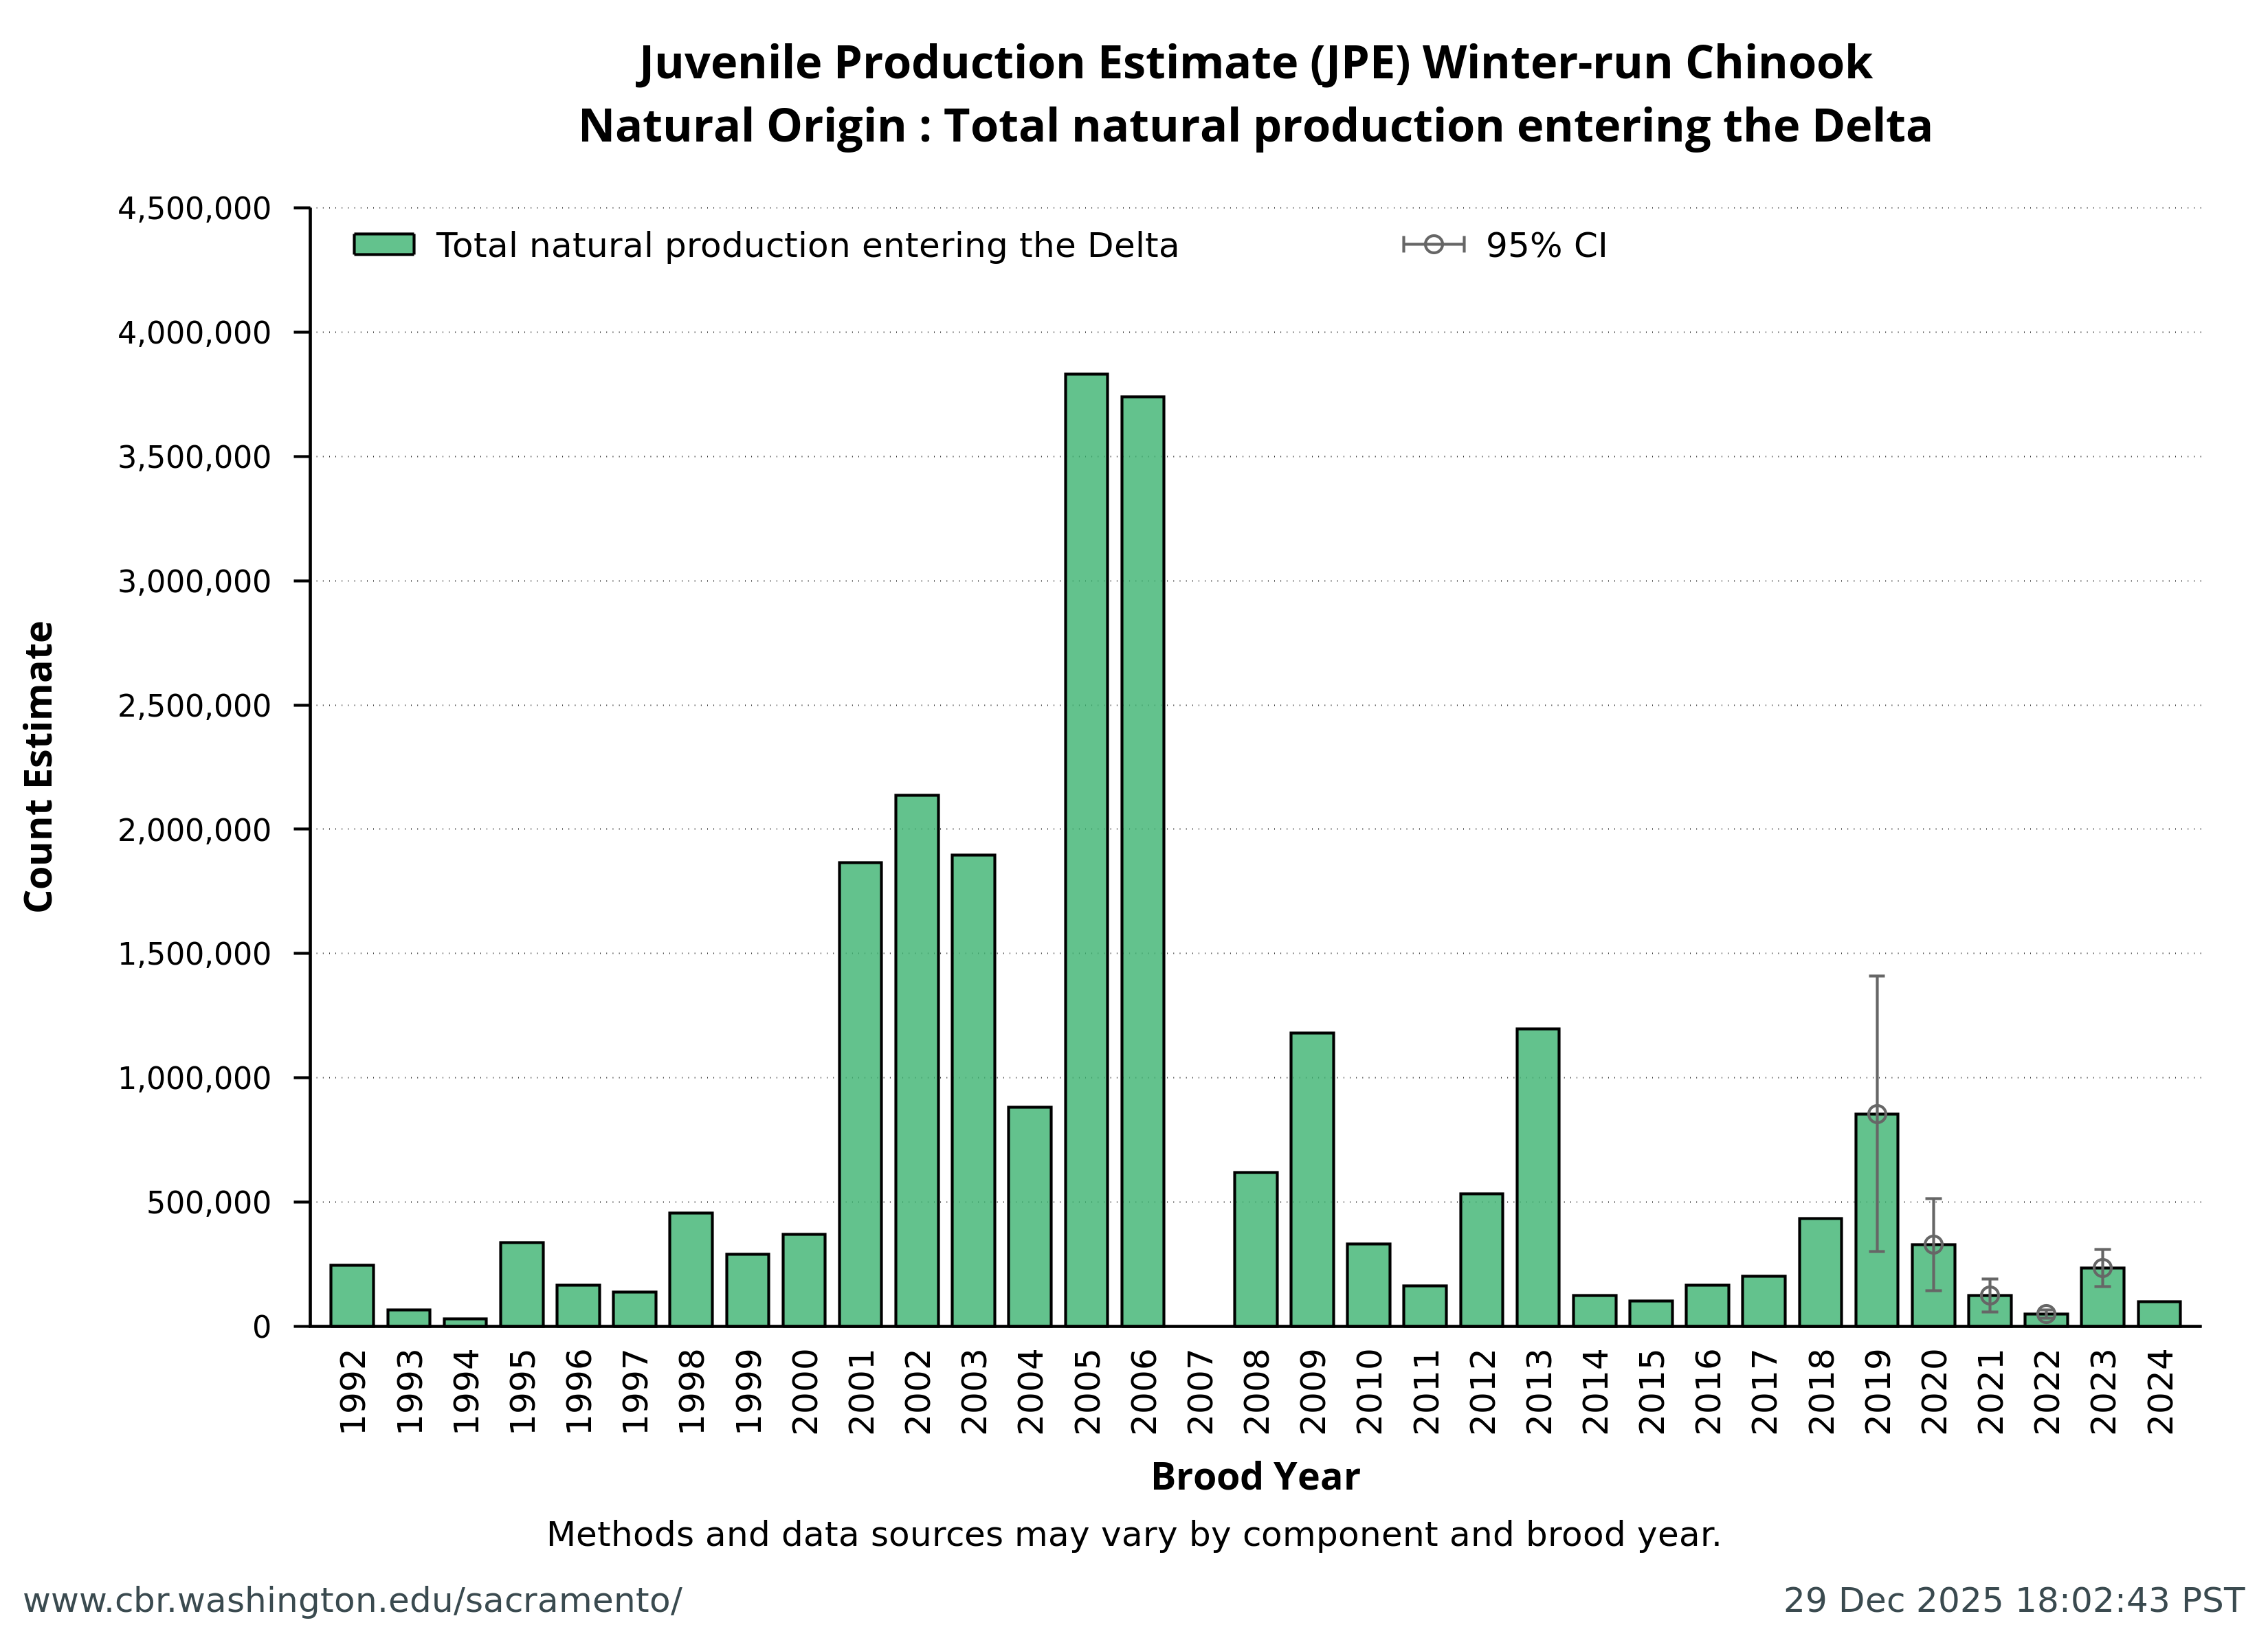
Juvenile Production Estimate JPE — annual data

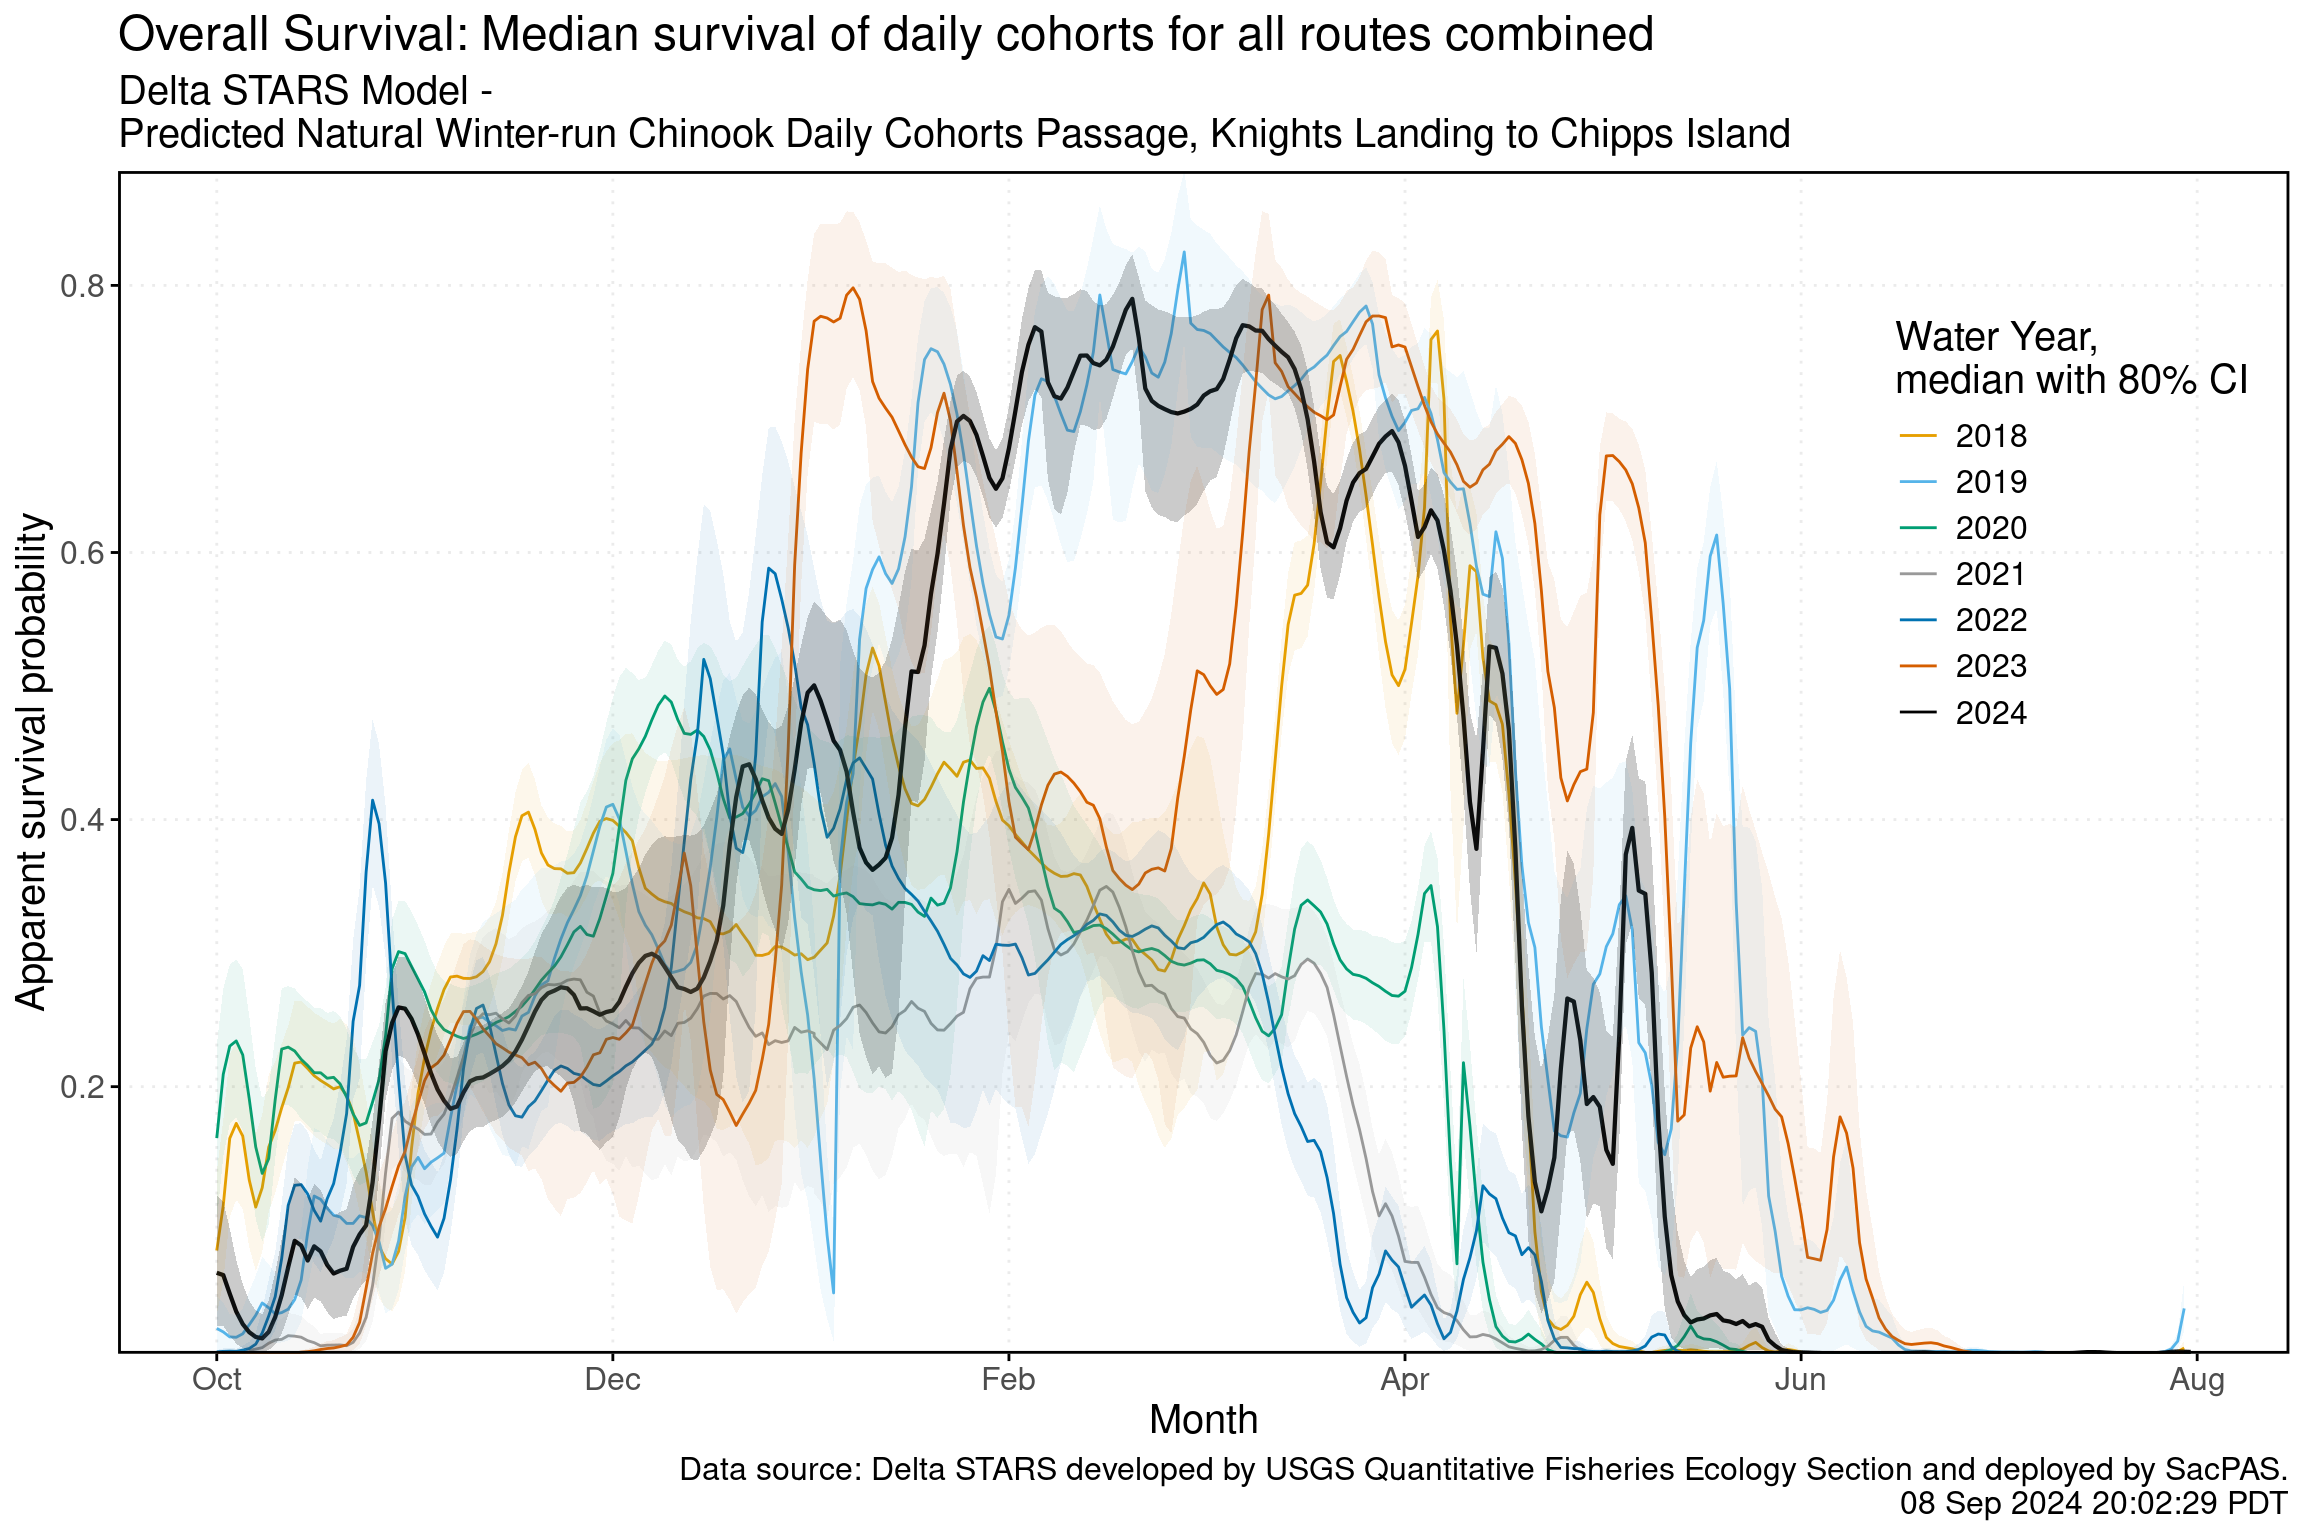
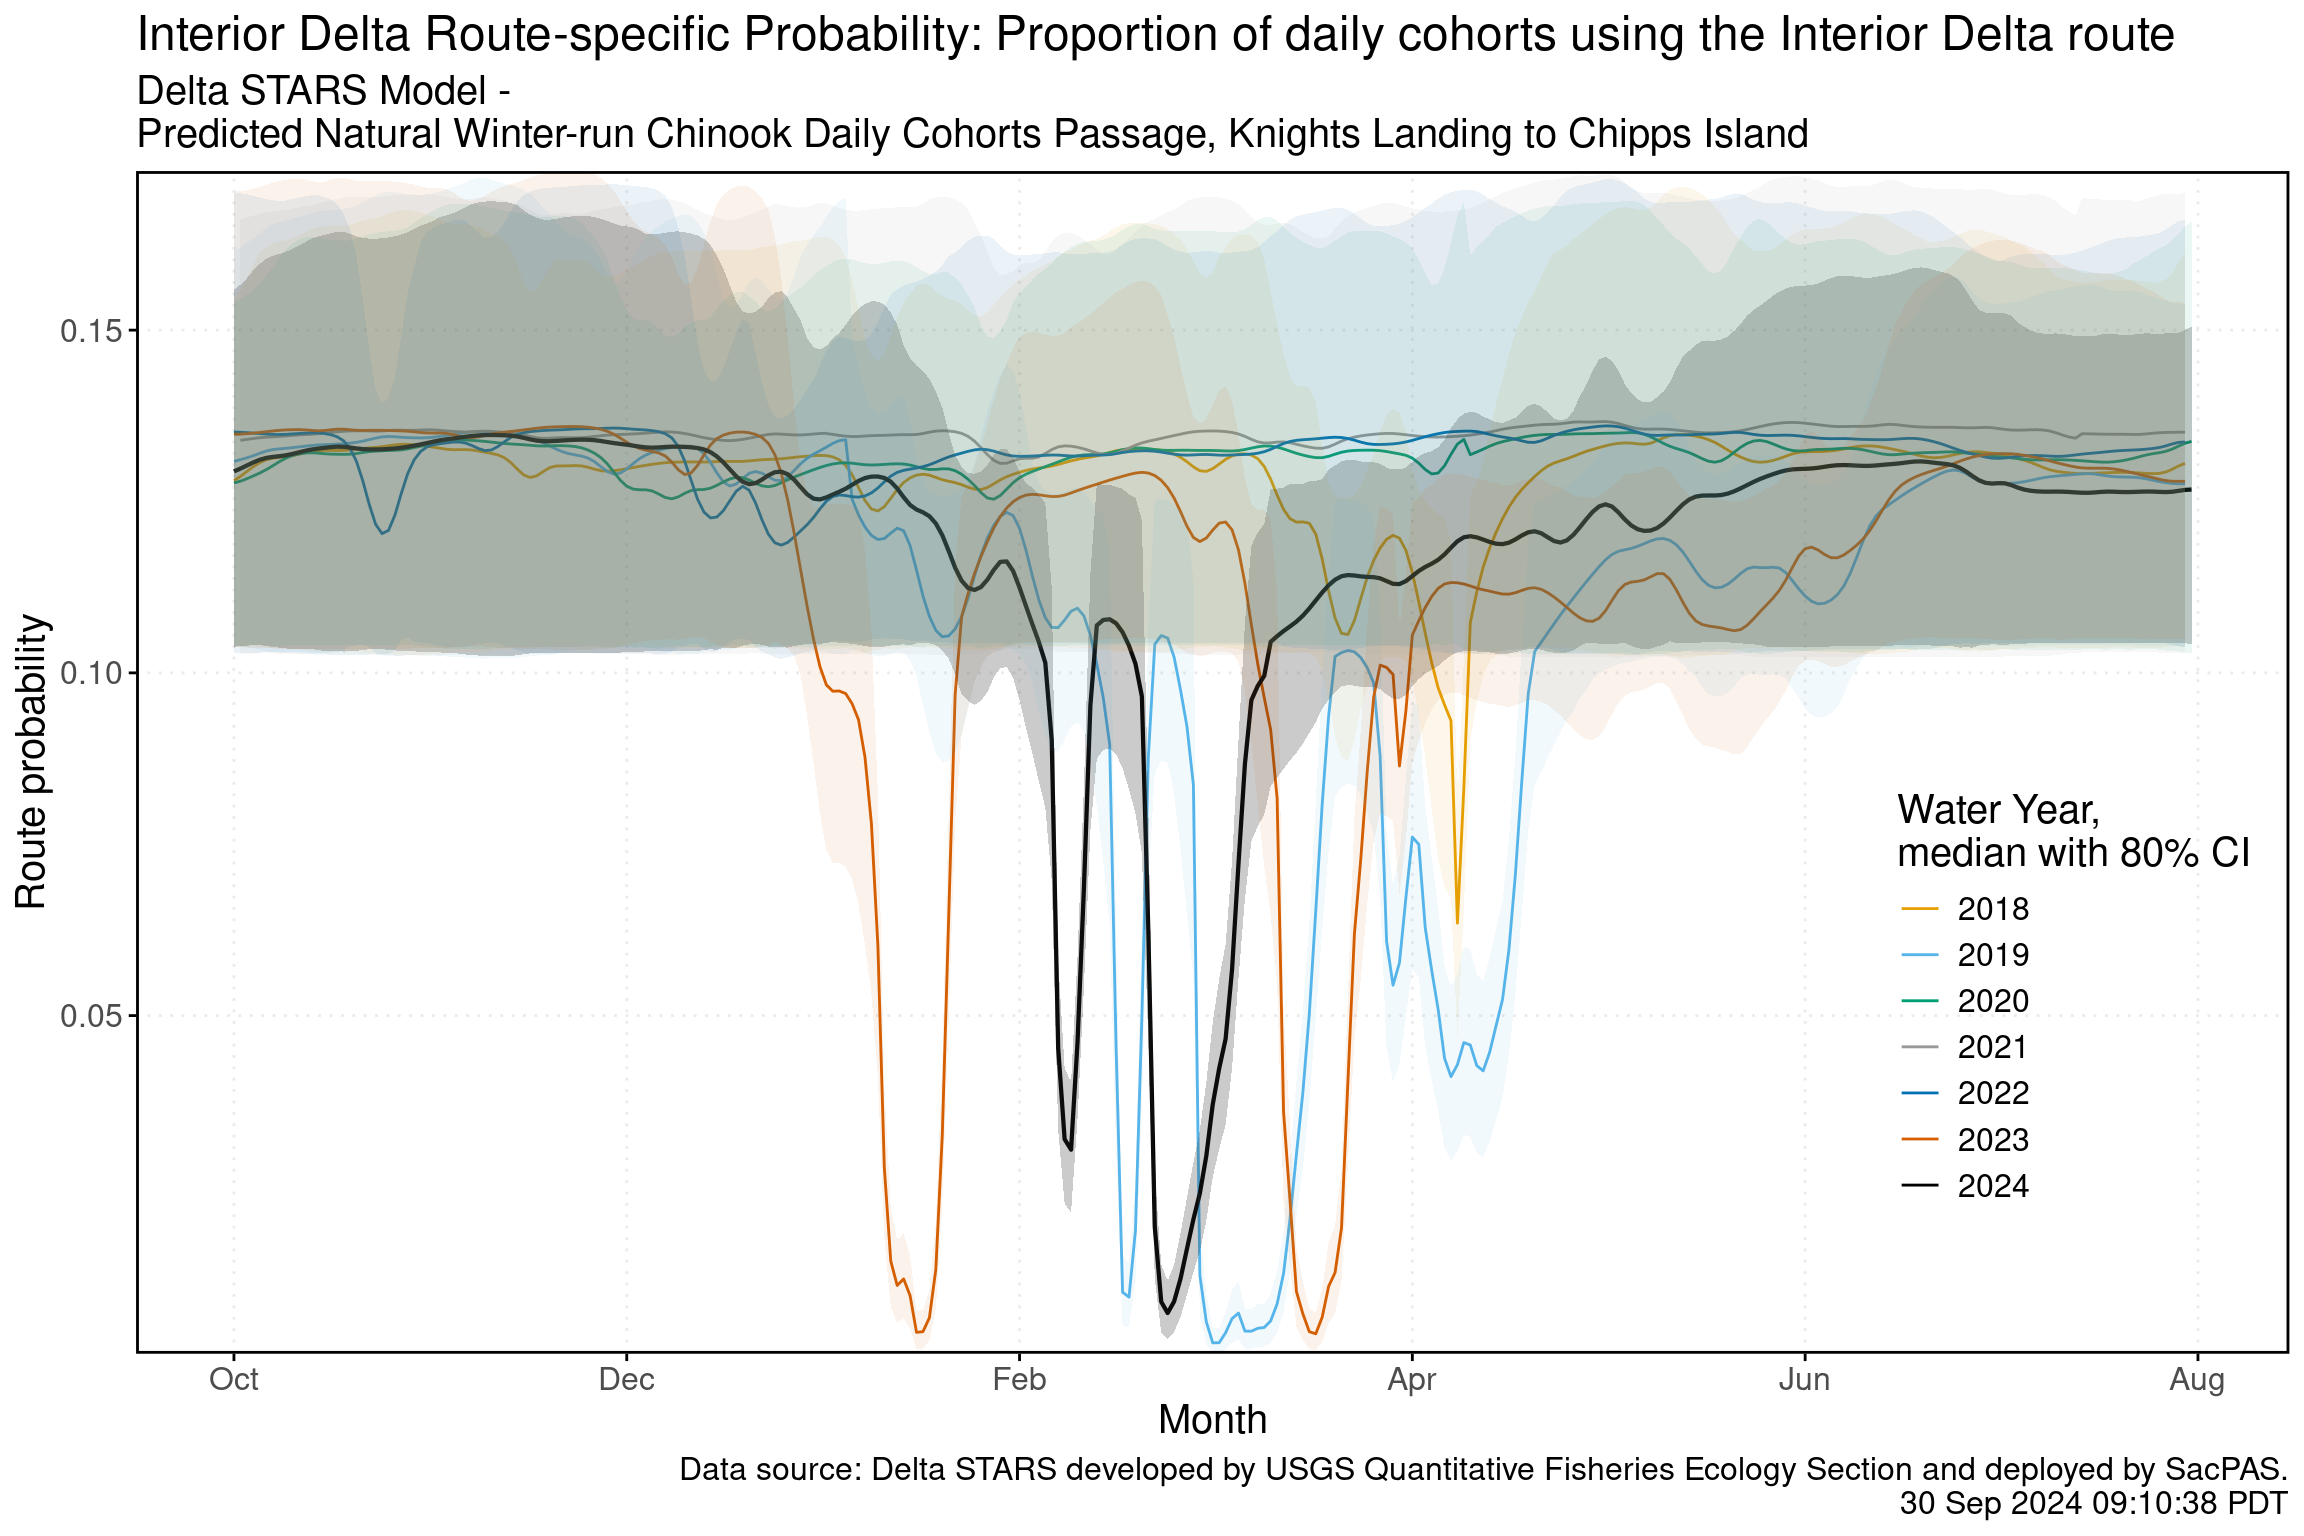
Delta STARS Survival and Routing Probabilities

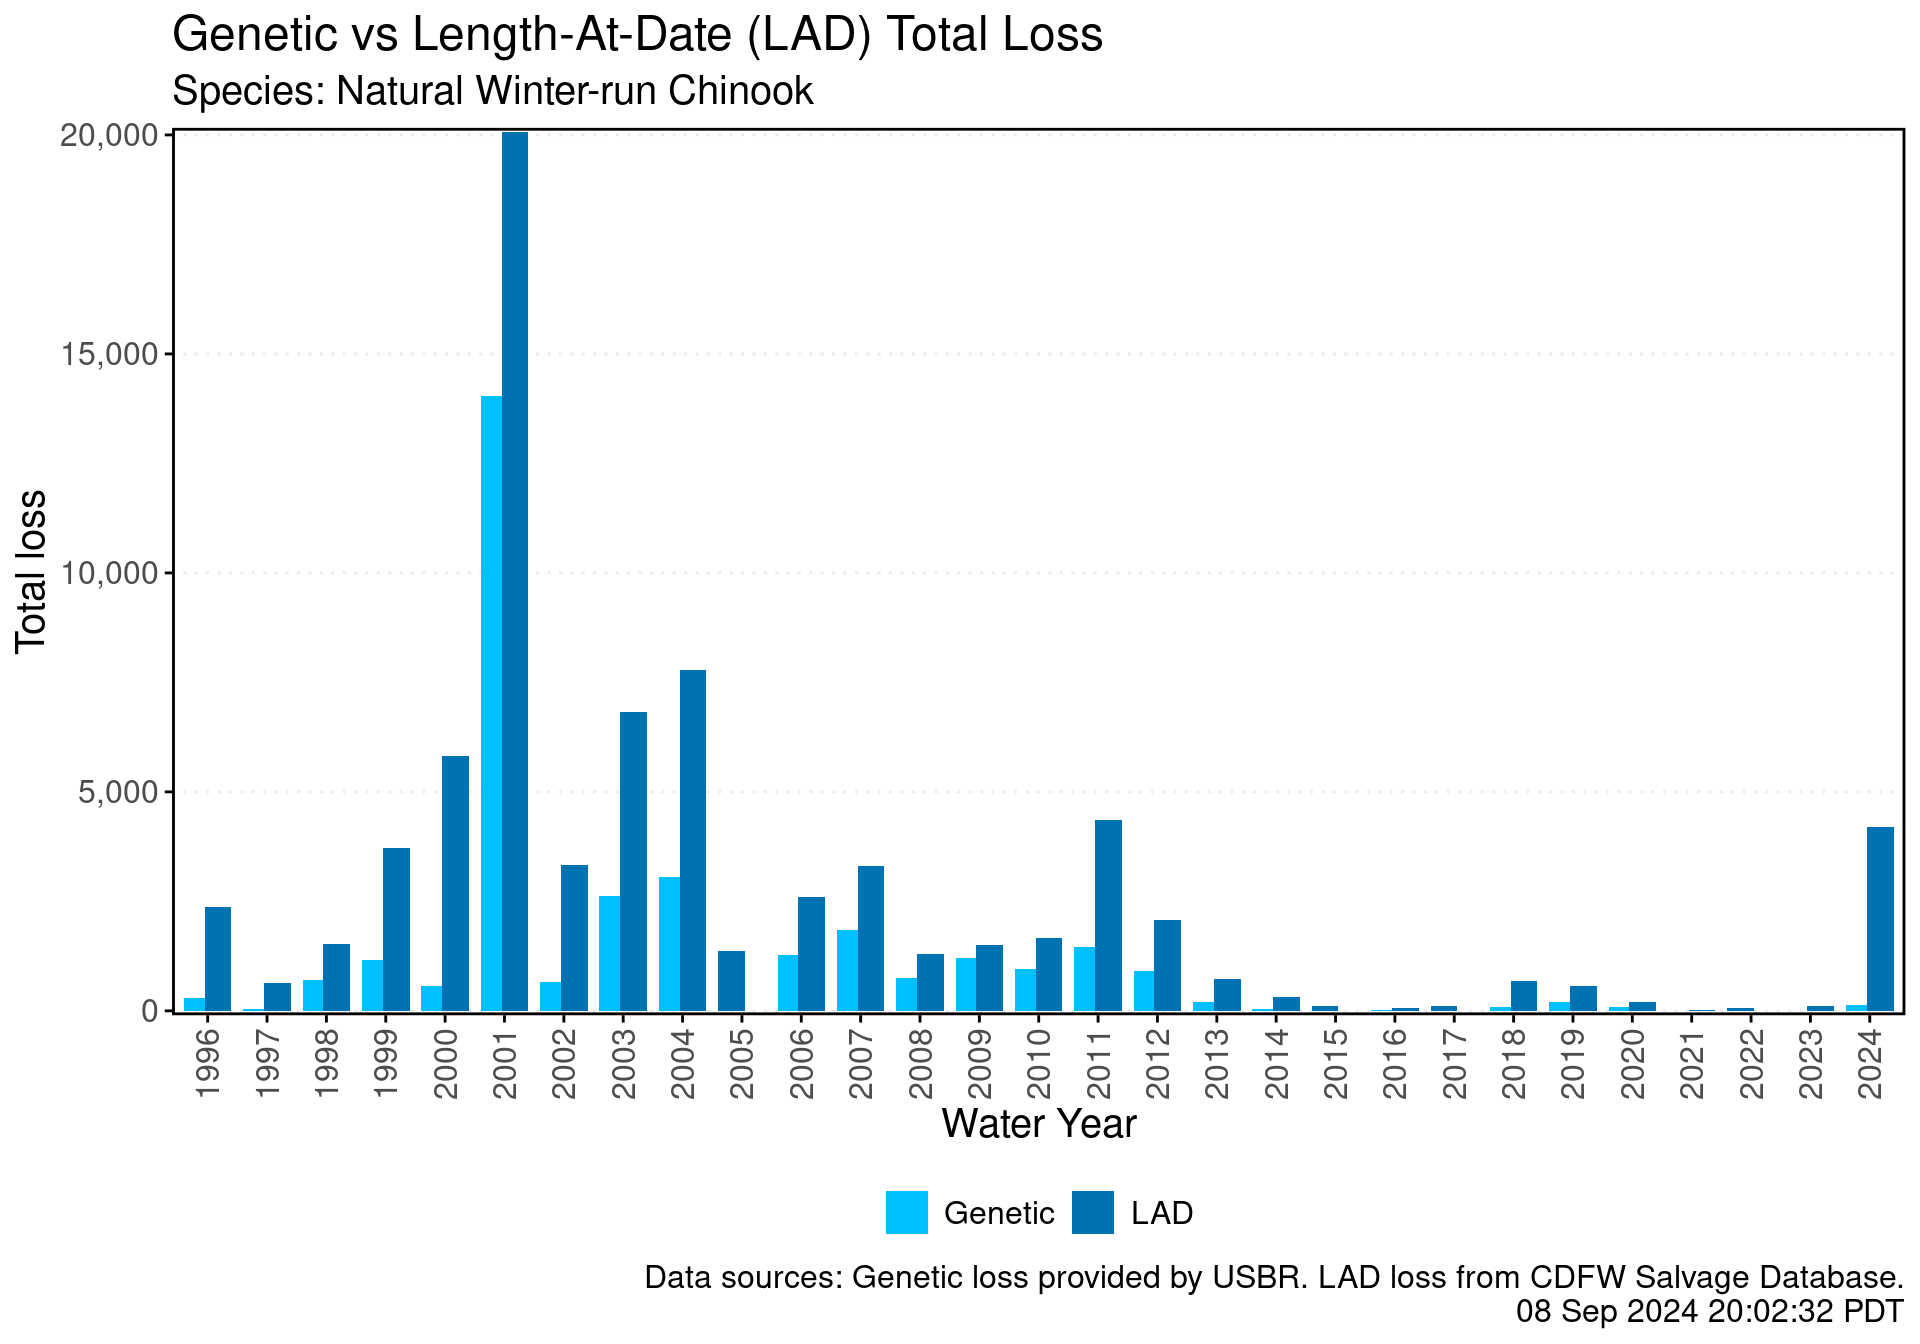
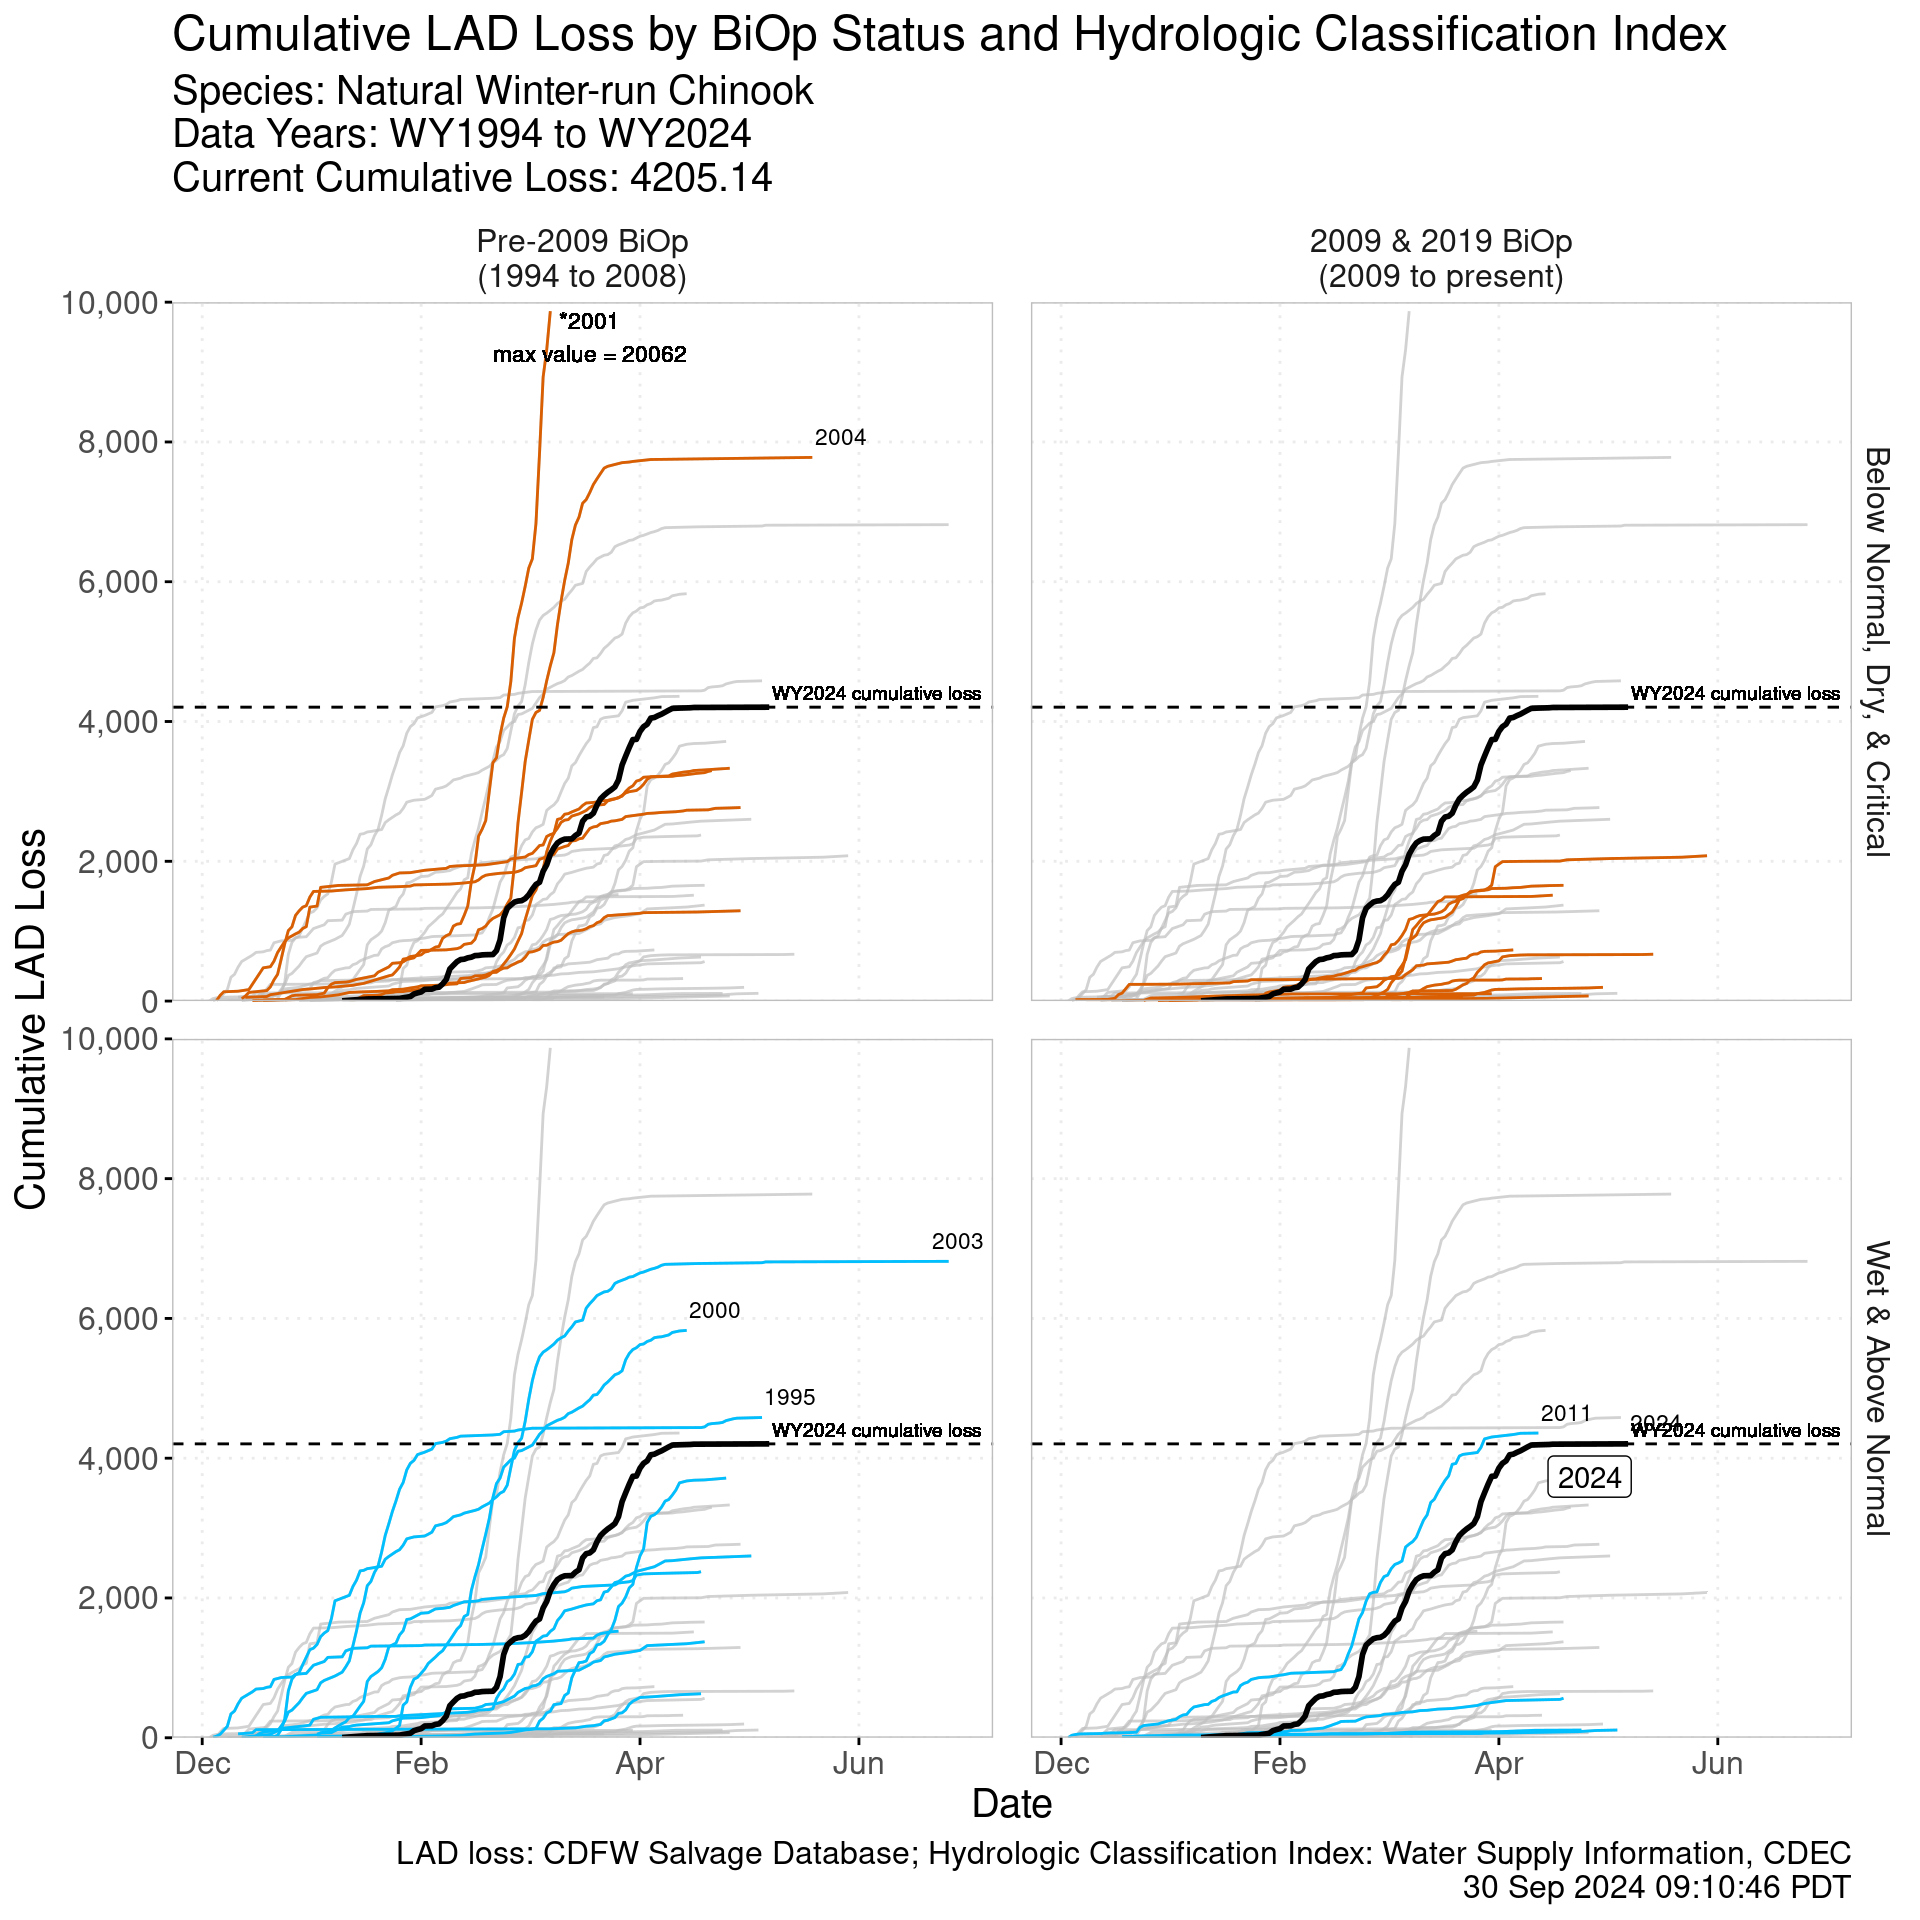
Percent Loss of Juvenile Production Estimate (JPE)
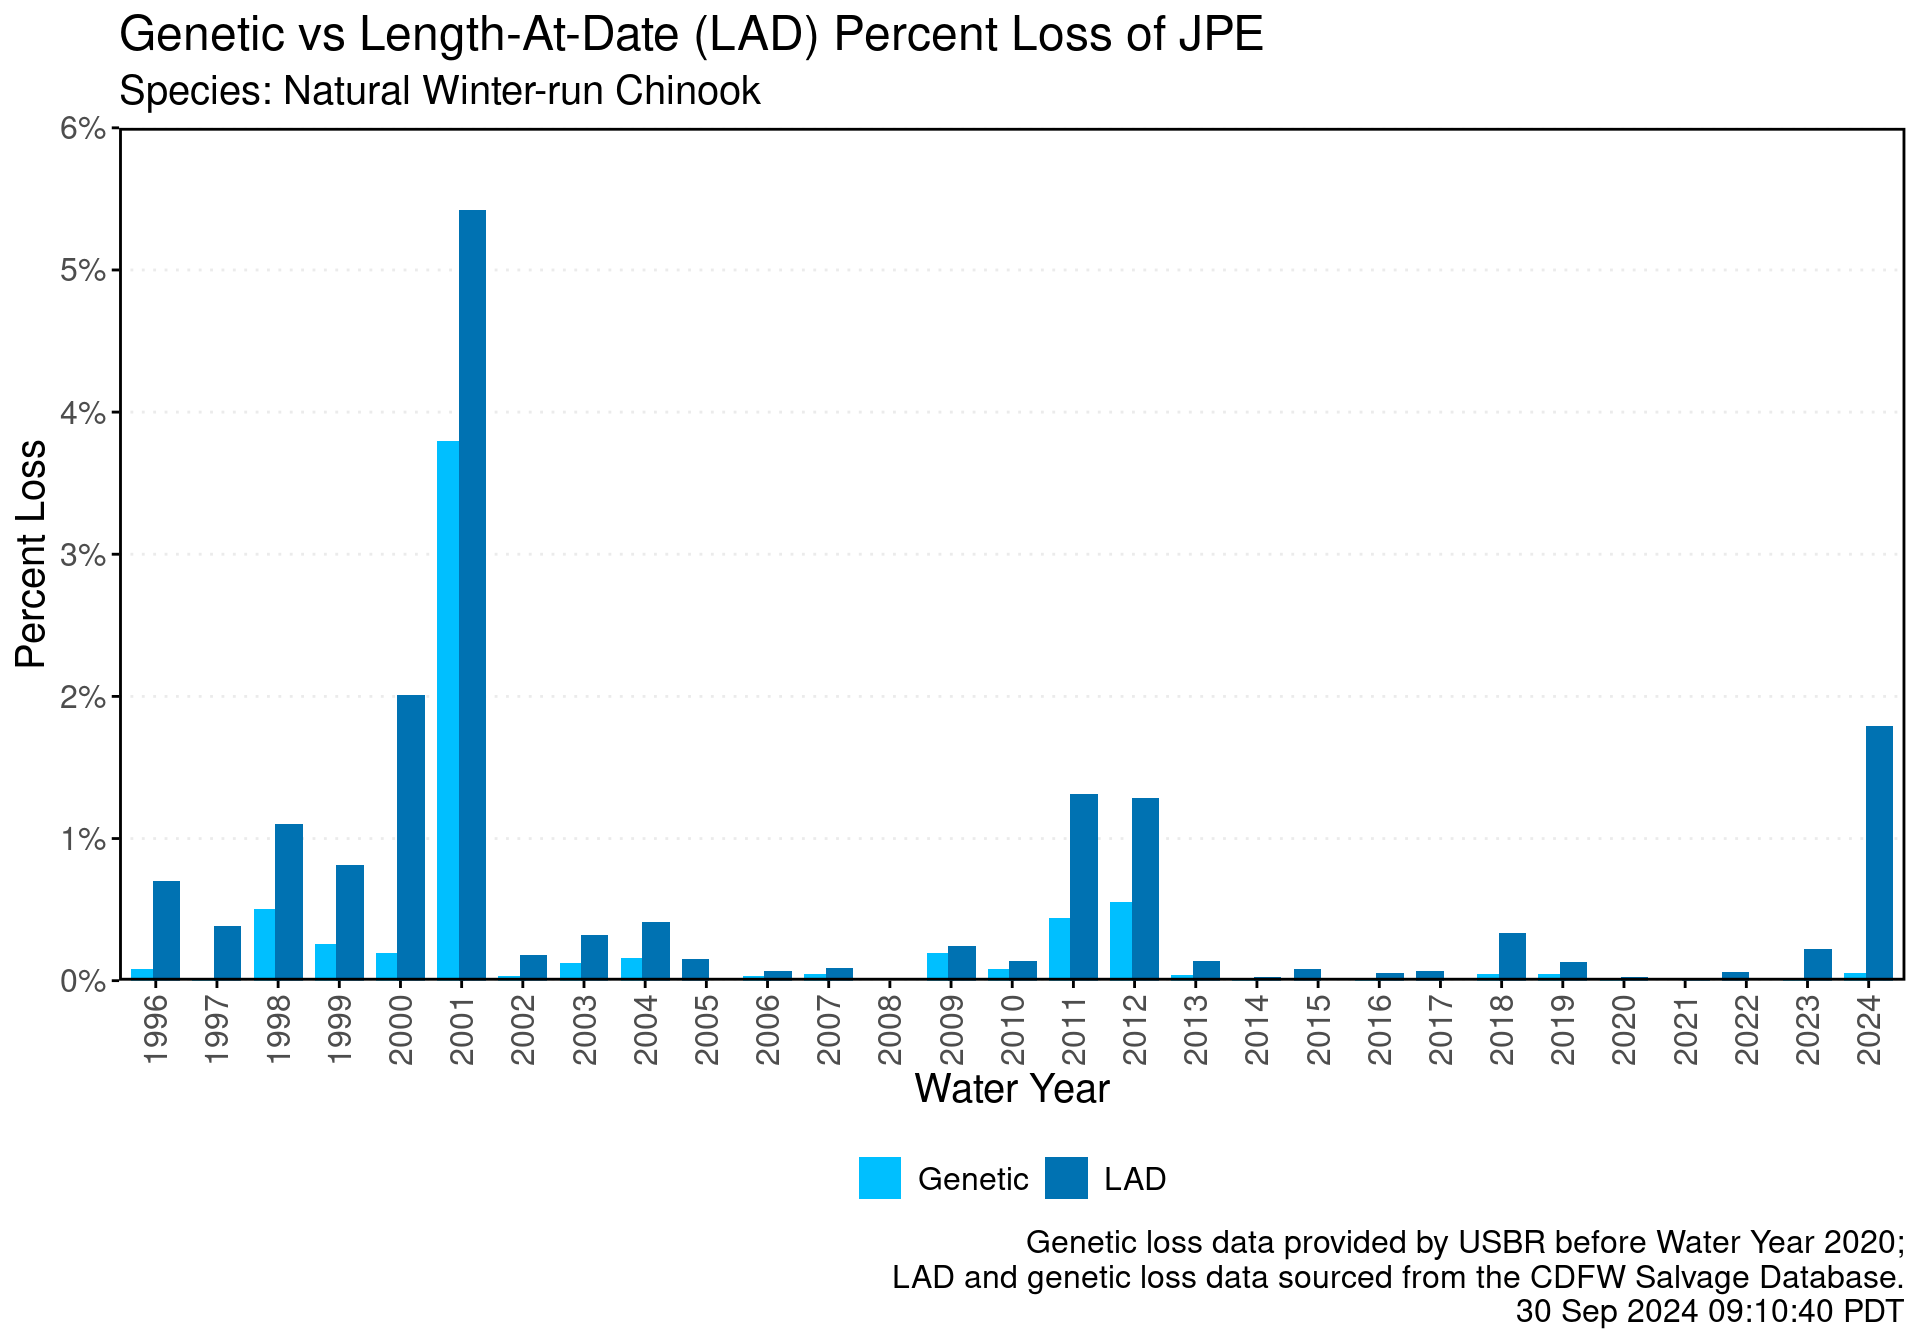
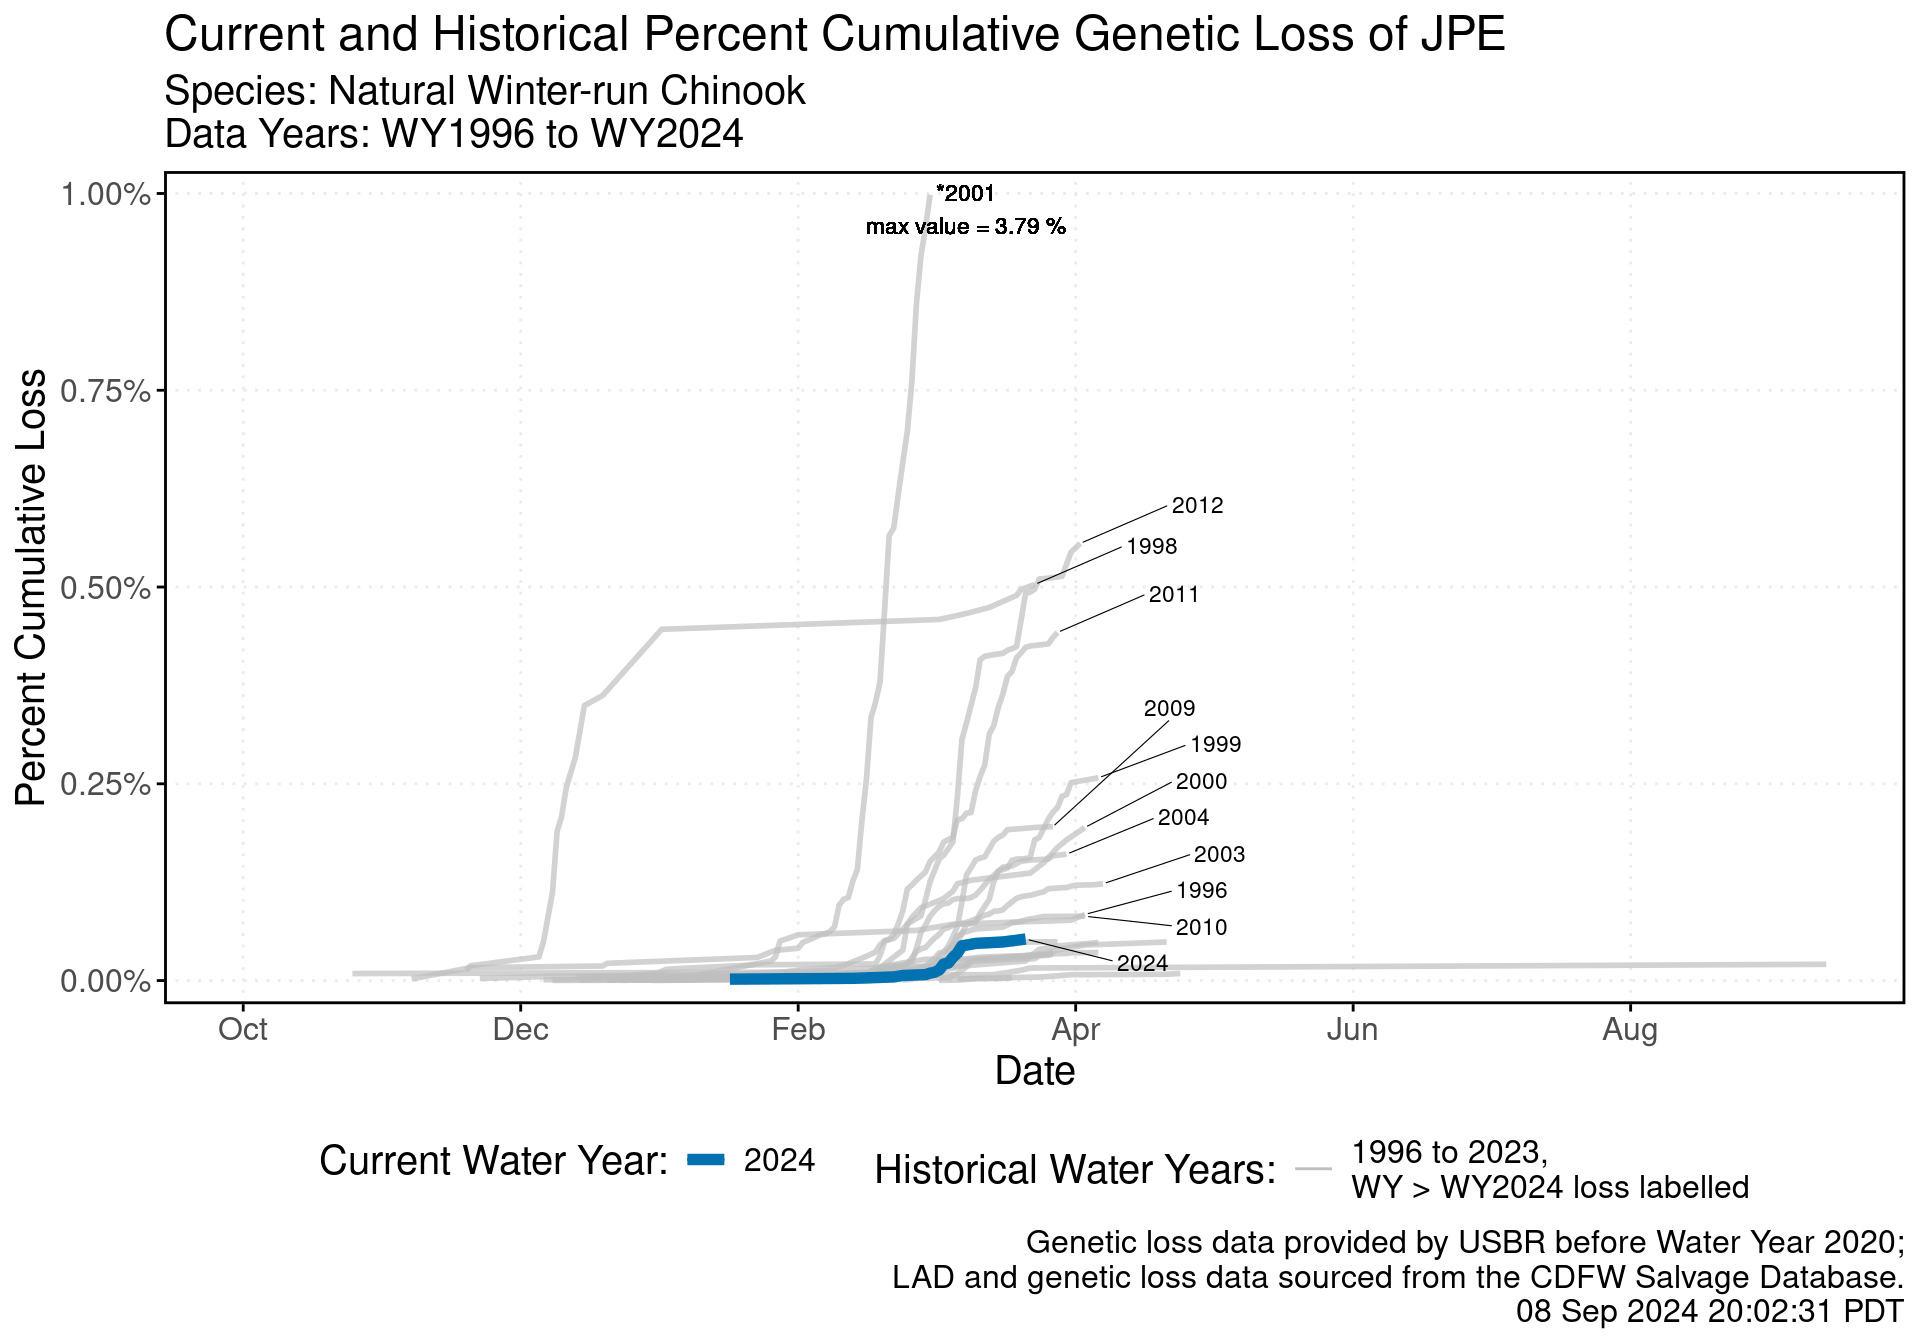
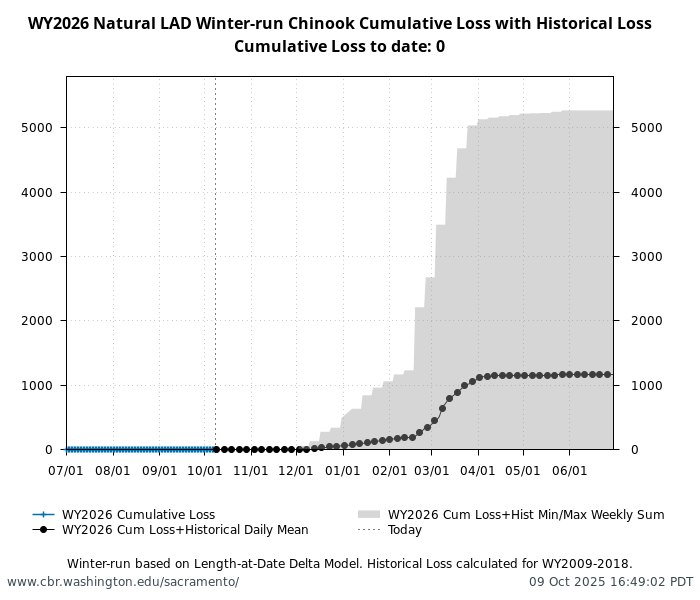
Loss
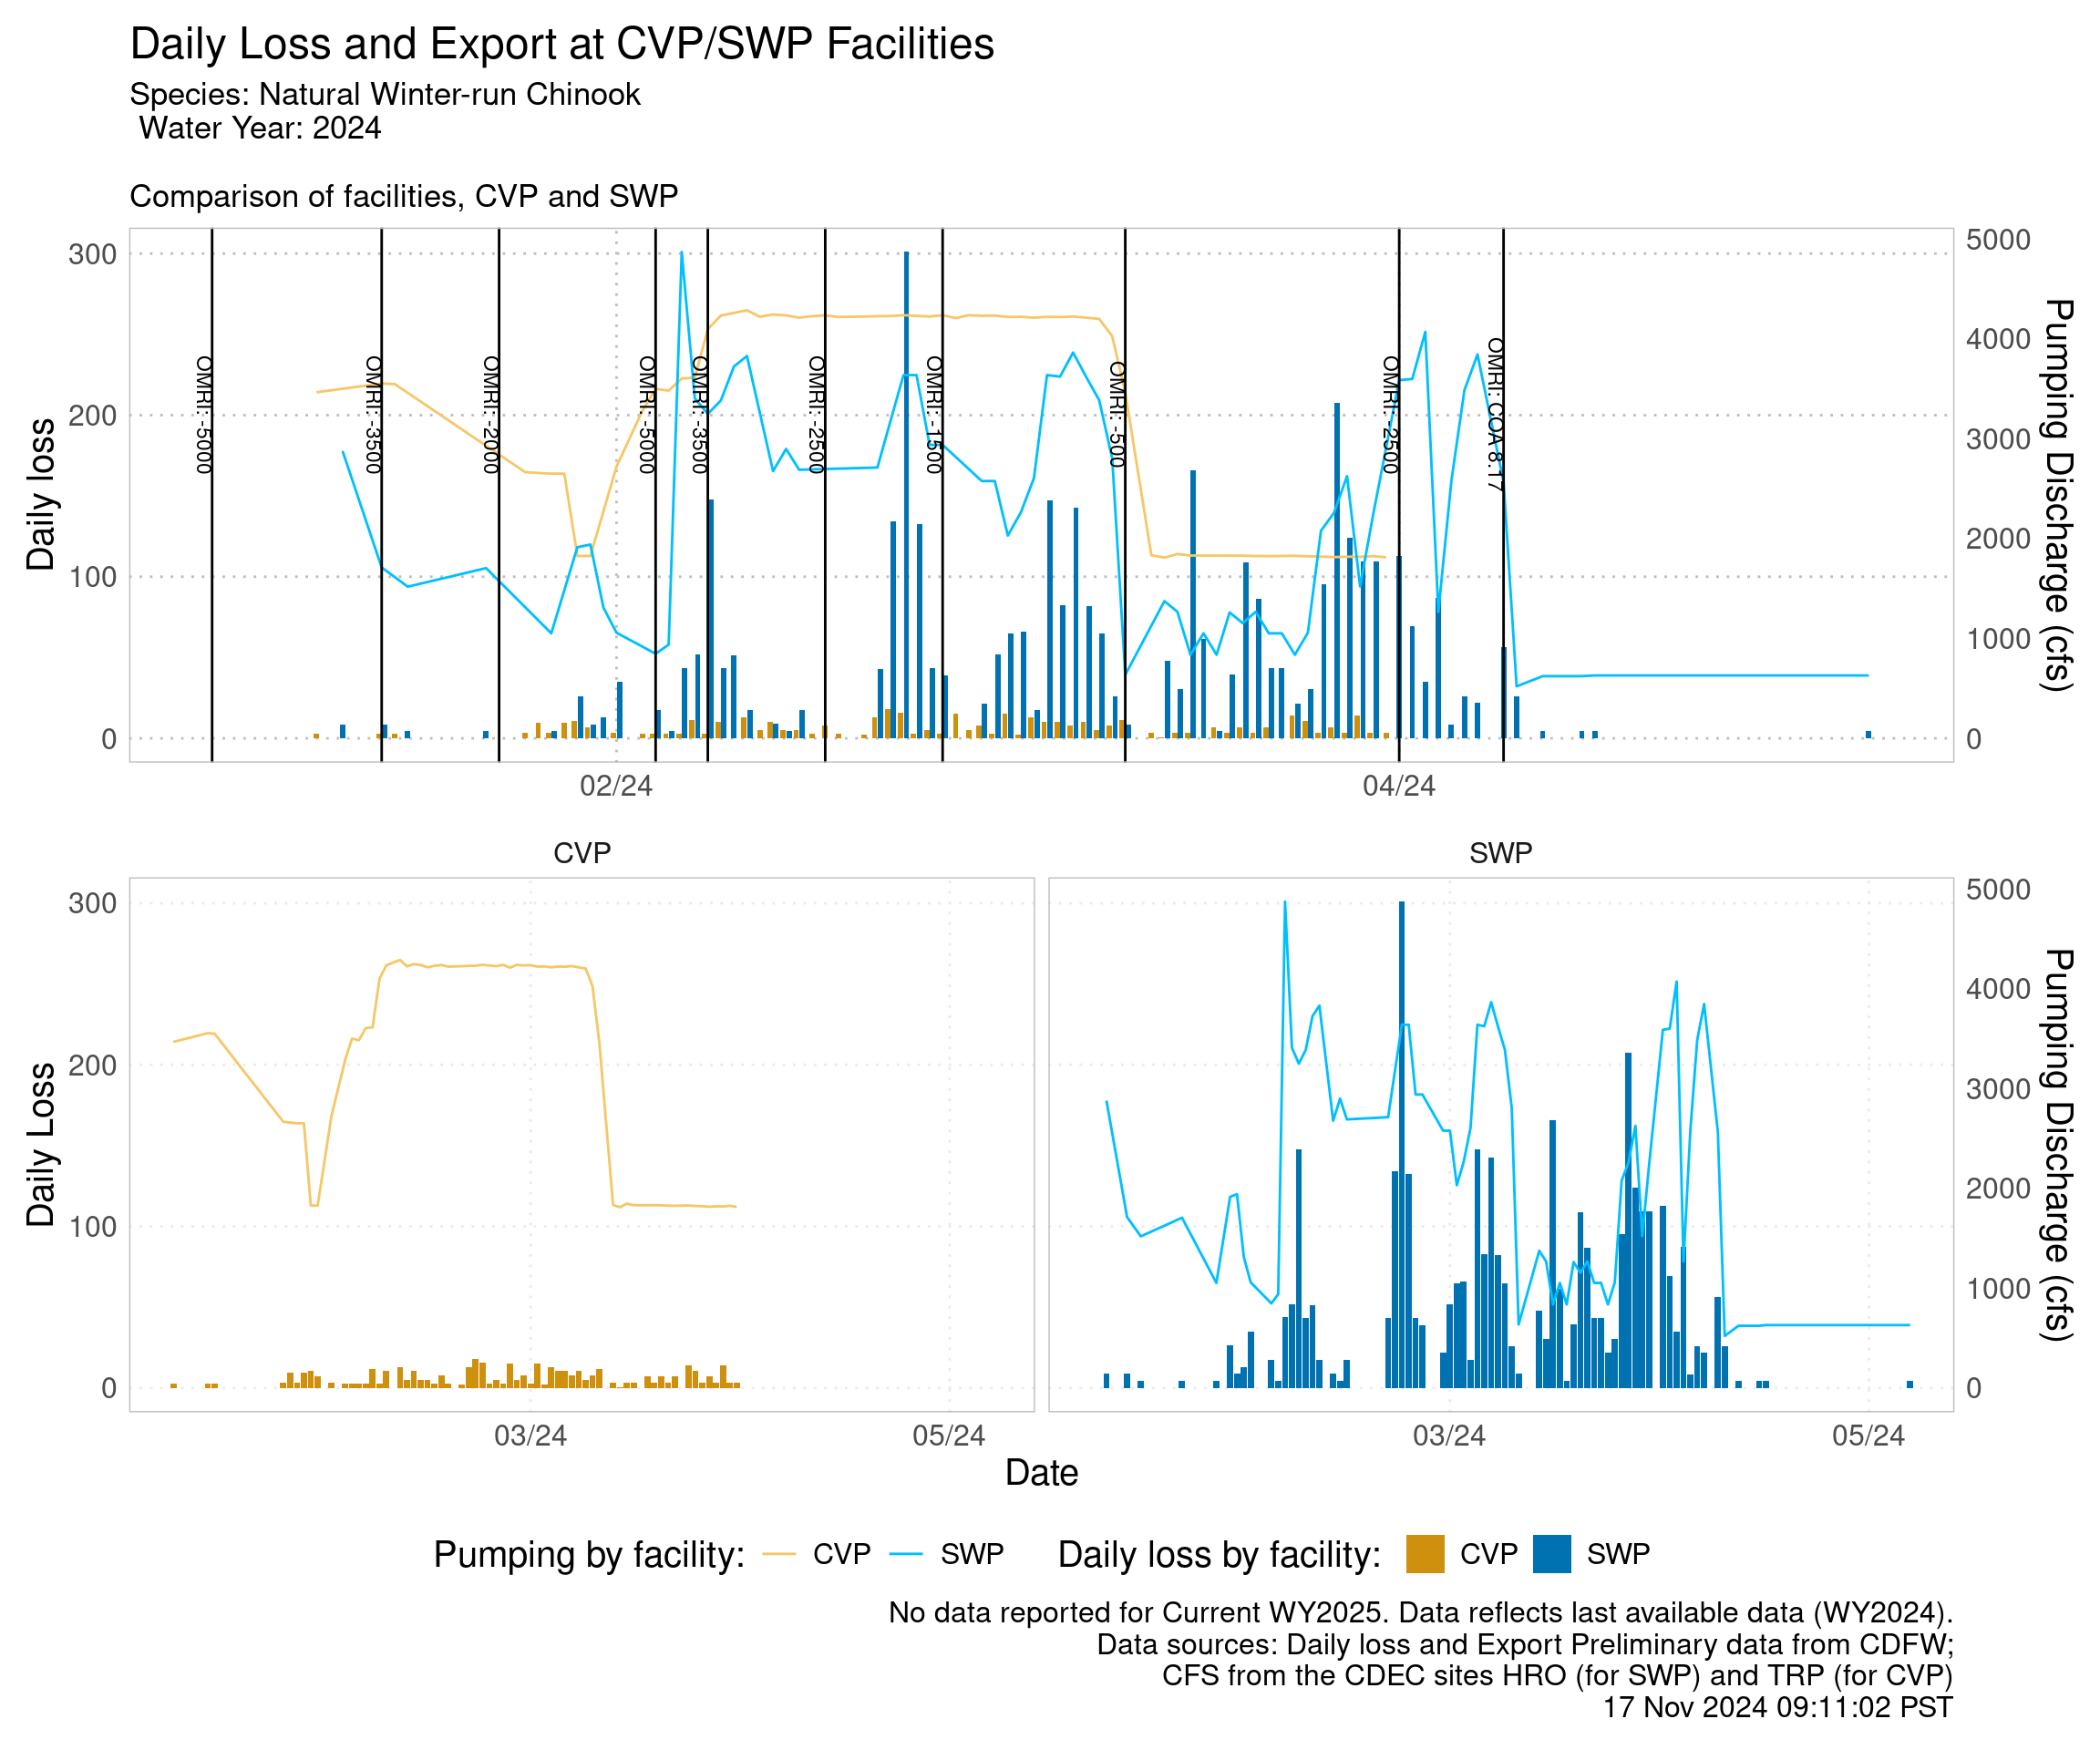
Daily Loss and Export with OMR
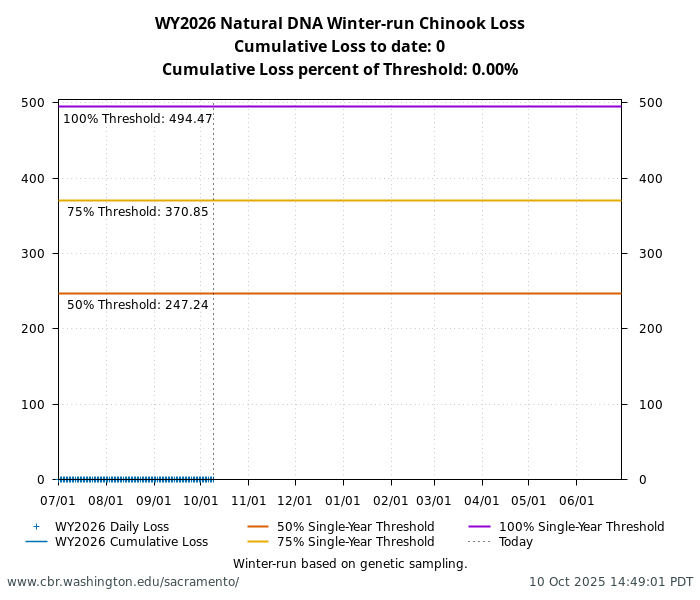
Loss Single Year Thresholds
Included from Salmonids, Steelhead, and Current Conditions for the Delta Actions Team (DAT), Workgroups & Teams.
Predicted Weekly Loss
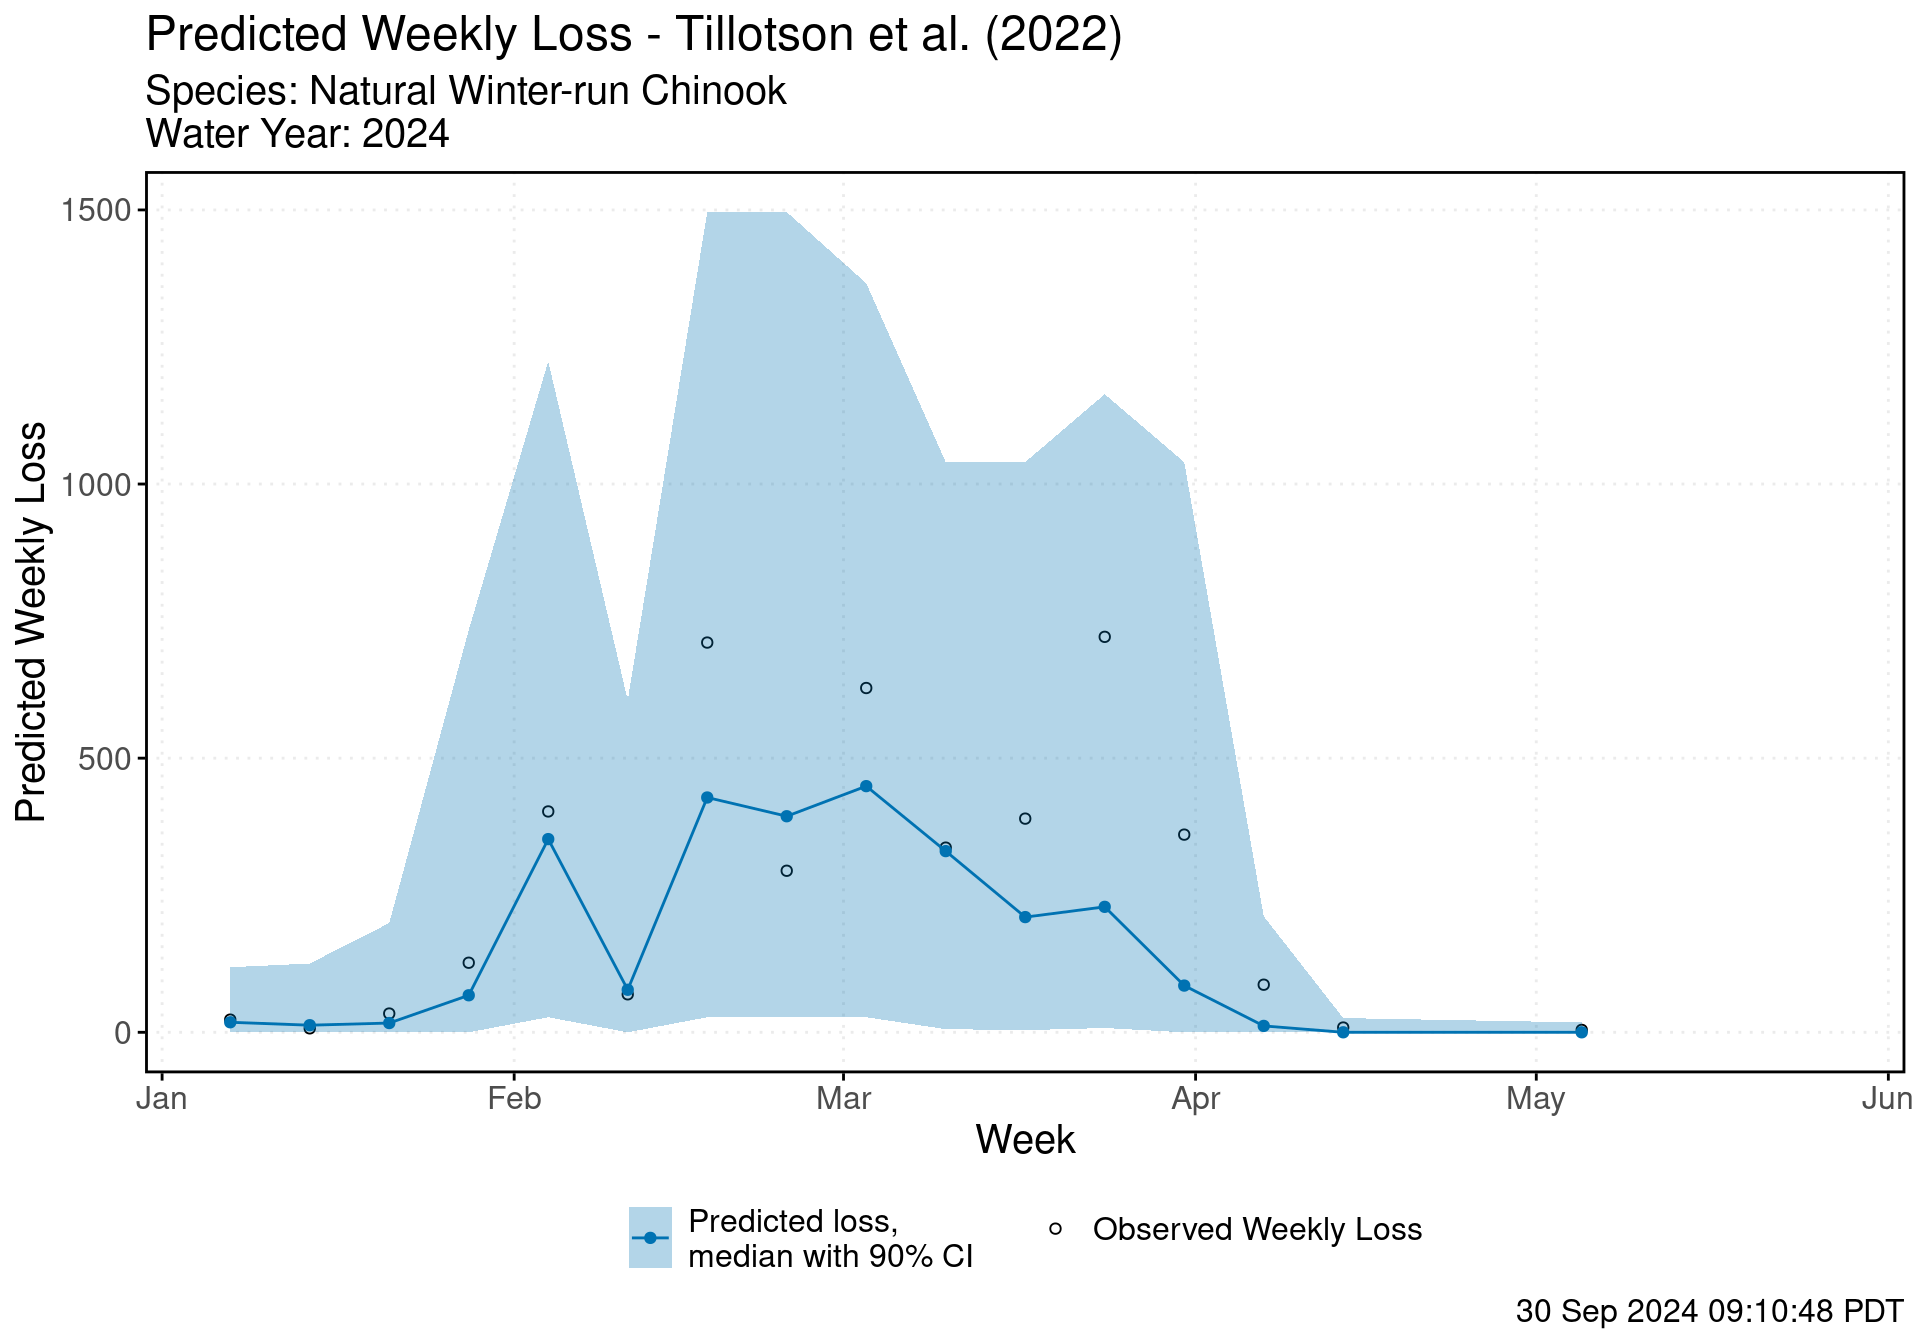
| WY week | Date | Median weekly predicted loss [lower CI, upper CI] | Observed Data | |||||
|---|---|---|---|---|---|---|---|---|
| Observed loss | OMR USGS tidally filtered (CFS) | Export, SWP & CVP (CFS) | Avg flow at Sacramento (CFS) | Avg flow at San Joaquin (CFS) | Avg water temperature at Mallard Island (°C) | |||
| 39 | 2026-06-24 | 0.0 [0.0, 0.0] | 0.0 | -3300.0 | 2078.7 | 15450.4 | 1574.4 | 20.4 |
| 38 | 2026-06-17 | 0.0 [0.0, 0.0] | 0.0 | -2439.9 | 1098.3 | 14280.9 | 1410.5 | 21.0 |
| 37 | 2026-06-10 | 0.0 [0.0, 0.0] | 0.0 | -4718.0 | 2676.4 | 12637.4 | 1508.6 | 21.4 |
| 36 | 2026-06-03 | 0.0 [0.0, 0.0] | 0.0 | -5016.0 | 3731.3 | 13681.0 | 1760.1 | 20.4 |
| 35 | 2026-05-27 | 0.0 [0.0, 0.0] | 0.0 | -3424.3 | 2384.8 | 13406.3 | 1904.3 | 19.3 |
| 34 | 2026-05-20 | 0.0 [0.0, 13.0] | 0.0 | -3062.9 | 2173.1 | 8298.7 | 2174.6 | 19.4 |
| 33 | 2026-05-13 | 0.0 [0.0, 19.4] | 0.0 | -4634.3 | 3578.4 | 11506.5 | 2032.8 | 19.1 |
| 32 | 2026-05-06 | 0.0 [0.0, 0.0] | 0.0 | -2333.9 | 1154.5 | 15116.0 | 1384.4 | 18.4 |
| 31 | 2026-04-29 | 0.0 [0.0, 0.0] | 0.0 | -2598.3 | 2252.5 | 17873.4 | 2462.3 | 17.4 |
| 30 | 2026-04-22 | 0.0 [0.0, 23.9] | 0.0 | -2302.6 | 2681.0 | 29602.2 | 3091.8 | 16.9 |
| 29 | 2026-04-15 | 0.0 [0.0, 20.7] | 0.0 | -2726.0 | 2098.0 | 29286.7 | 2393.2 | 17.2 |
| 28 | 2026-04-08 | 0.0 [0.0, 22.0] | 0.0 | -3701.7 | 3542.2 | 22207.3 | 2441.6 | 18.2 |
| 27 | 2026-04-01 | 0.0 [0.0, 40.9] | 0.0 | -4421.4 | 3989.4 | 13603.1 | 2346.7 | 18.4 |
| 26 | 2026-03-25 | 0.0 [0.0, 97.5] | 4.3 | -6158.6 | 5753.1 | 12893.3 | 2041.2 | 18.5 |
| 25 | 2026-03-18 | 0.0 [0.0, 114.6] | 5.2 | -5634.3 | 5969.5 | 19084.5 | 3628.3 | 17.8 |
| 24 | 2026-03-11 | 17.3 [0.0, 218.6] | 8.7 | -5661.4 | 6773.6 | 25672.7 | 4826.0 | 15.4 |
| 23 | 2026-03-04 | 46.7 [0.0, 464.2] | 10.1 | -5994.3 | 7243.9 | 42033.9 | 5716.3 | 14.0 |
| 22 | 2026-02-25 | 72.0 [0.0, 931.5] | 27.2 | -6070.0 | 7987.7 | 52562.8 | 7268.9 | 12.4 |
| 21 | 2026-02-18 | 66.2 [0.0, 964.1] | 17.3 | -5805.7 | 7702.2 | 43778.6 | 7631.4 | 11.2 |
| 20 | 2026-02-11 | 17.1 [0.0, 719.2] | 0.0 | -5071.4 | 5272.2 | 31045.7 | 2936.8 | 12.3 |
| 19 | 2026-02-04 | 6.4 [0.0, 222.5] | 3.5 | -3932.9 | 4147.5 | 29629.5 | 2320.6 | 11.7 |
| 18 | 2026-01-28 | 16.8 [0.0, 222.5] | 27.5 | -3583.3 | 3575.2 | 25745.4 | 2041.0 | 10.9 |
| 17 | 2026-01-21 | 17.1 [0.0, 117.7] | 4.3 | -5664.3 | 6076.6 | 32142.8 | 2339.5 | 10.4 |
| 16 | 2026-01-14 | 17.1 [0.0, 109.4] | 0.0 | -4711.4 | 5506.9 | 47209.2 | 2576.4 | 10.4 |
| 15 | 2026-01-07 | 17.4 [0.0, 107.5] | 0.0 | -5178.6 | 6781.0 | 70255.2 | 3328.3 | 10.8 |
| 14 | 2025-12-31 | 17.1 [0.0, 109.4] | 0.0 | -5344.3 | 5673.3 | 63590.4 | 2732.9 | 11.0 |
| 13 | 2025-12-24 | 17.1 [0.0, 133.0] | 2.9 | -5665.7 | 6727.9 | 63788.2 | 3999.7 | 11.7 |
| 12 | 2025-12-17 | 0.0 [0.0, 116.8] | 0.0 | -5751.4 | 6841.4 | 22016.3 | 3421.3 | 10.4 |
| 11 | 2025-12-10 | 0.0 [0.0, 11.7] | 0.0 | -3388.6 | 2922.0 | 10079.5 | 1161.4 | 10.1 |
| 10 | 2025-12-03 | 0.0 [0.0, 16.9] | 0.0 | -3607.3 | 3456.7 | 10460.5 | 2037.8 | 11.7 |
| 9 | 2025-11-26 | 0.0 [0.0, 9.5] | 0.0 | -6551.4 | 7064.3 | 12044.9 | 1292.4 | 13.4 |
| 8 | 2025-11-19 | 0.0 [0.0, 16.4] | 0.0 | -8214.3 | 9724.4 | 16832.3 | 1911.5 | 15.4 |
| 7 | 2025-11-12 | 0.0 [0.0, 0.0] | 0.0 | -7208.6 | 4097.9 | 12650.7 | 1325.2 | 16.9 |
| 6 | 2025-11-05 | 0.0 [0.0, 0.0] | 0.0 | -5752.9 | 5641.6 | 10914.5 | 1147.7 | 17.6 |
| 5 | 2025-10-29 | 0.0 [0.0, 0.0] | 0.0 | -5190.0 | 4730.4 | 11089.9 | 1682.7 | 17.7 |
| 4 | 2025-10-22 | 0.0 [0.0, 0.0] | 0.0 | -4530.0 | 4474.4 | 11554.7 | 2092.1 | 18.1 |
| 3 | 2025-10-15 | 0.0 [0.0, 0.0] | 0.0 | -4995.7 | 4695.4 | 12199.6 | 2095.0 | 18.5 |
| 2 | 2025-10-08 | 0.0 [0.0, 0.0] | 0.0 | -5984.3 | 5233.0 | 15629.0 | 1260.7 | 19.8 |
| 1 | 2025-10-01 | 0.0 [0.0, 0.0] | 0.0 | -9802.9 | 9468.0 | 18779.4 | 1021.0 | 20.7 |
Adults in Ocean
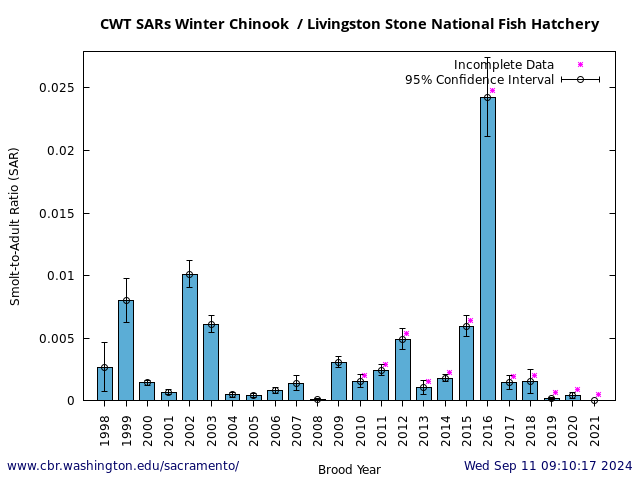
CWT Smolt-to-Adult — annual data
PFMC Abundance, Harvest, Impact — annual data
| Year a | 3-Year Geometric Mean b | Abundance Forecast c | Postseason Abundance d | Postseason Abundance Value Footnote | Age-3 impact rate south of Point Arena, CA | |||
|---|---|---|---|---|---|---|---|---|
| Maximum Allowable (%) e | Preseason Forecast (%) | Postseason Estimate (%) | Postseason Estimate Value Footnote | |||||
| 2000 | 21.4 | |||||||
| 2001 | 8508 | 23.3 | ||||||
| 2002 | 9092 | 21.8 | ||||||
| 2003 | 5976 | 10.3 | ||||||
| 2004 | 18090 | 24.8 | ||||||
| 2005 | 18907 | 17.2 | ||||||
| 2006 | 2619 | 15.1 | ||||||
| 2007 | 2954 | 17.8 | ||||||
| 2008 | 4152 | 0.0 | ||||||
| 2009 | 1439 | 0.0 | ||||||
| 2010 | 696 | e | ||||||
| 2011 | 3263 | 28.3 | ||||||
| 2012 | 1797 | 5960 | 13.7 | 13.7 | 12.6 | |||
| 2013 | 1521 | 3067 | 12.9 | 12.9 | 18.8 | |||
| 2014 | 2380 | 3718 | 15.4 | 15.4 | 15.8 | |||
| 2015 | 3659 | 867 | 19.0 | 17.5 | e | |||
| 2016 | 3981 | 508 | 19.9 | 12.8 | 10.7 | |||
| 2017 | 2521 | 2117 | 15.8 | 12.2 | 17.6 | |||
| 2018 | 1594 | 8139 | 14.4 | 8.5 | 13.9 | |||
| 2019 | 1924 | 6935 | 15.7 | 14.8 | 10.0 | |||
| 2020 | 3077 | 10854 | 20.0 | 16.2 | 12.6 | |||
| 2021 | 9063 | 6346 | 20.0 | 14.7 | 18.8 | |||
| 2022 | 5971 | 3071 | 20.0 | 15.2 | 26.2 | g | ||
| 2023 | 4540 | f | 20.0 | 0.0 | NA | h | ||
| 2024 | 1013 | f | 12.1 | — | — | |||
| 2025 | 4507 | f | 20.0 | 1.6 | NA | |||
| 2026 i | 9883 | f | 20.0 | NA | NA | |||
- Table II-2 Footnotes
- a/ Year indicates the management year in which age-3 SRWC are exposed to ocean fisheries.
- b/ Allowable impact rates from 2012-2017 were determined by an abundance-based control rule, where abundance was defined as the most recent three-year geometric mean of escapement.
- c/ Since 2018 the abundance forecast has been defined as the predicted age-3 escapement in the absence of fisheries. Forecasts were made using a life cycle model through 2023. Beginning in 2024, forecasts were made using a Gaussian Process model.
- d/ Postseason estimates of the age-3 escapement in the absence of fisheries.
- e/ Beginning in 2018, allowable impact rates were determined by a new control rule utilizing forecasts of the age-3 escapement in the absence of fisheries.
- f/ Insufficient data for postseason estimate.
- g/ Preliminary. Incomplete cohort data (age-4 escapement unavailable).
- h/ Not estimated. Incomplete cohort data (age-3 and age-4 escapement unavailable).
- i/ Year 2026 is Preliminary.
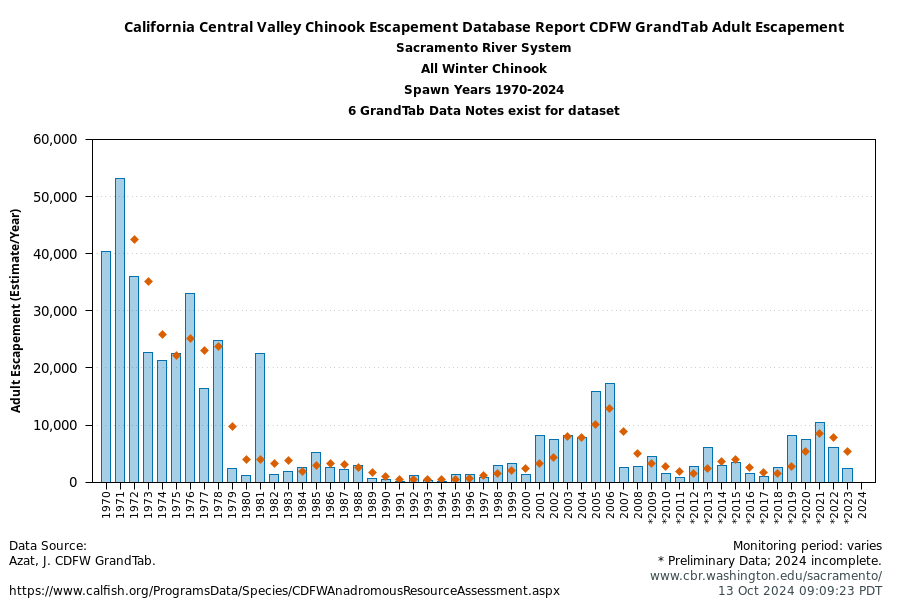
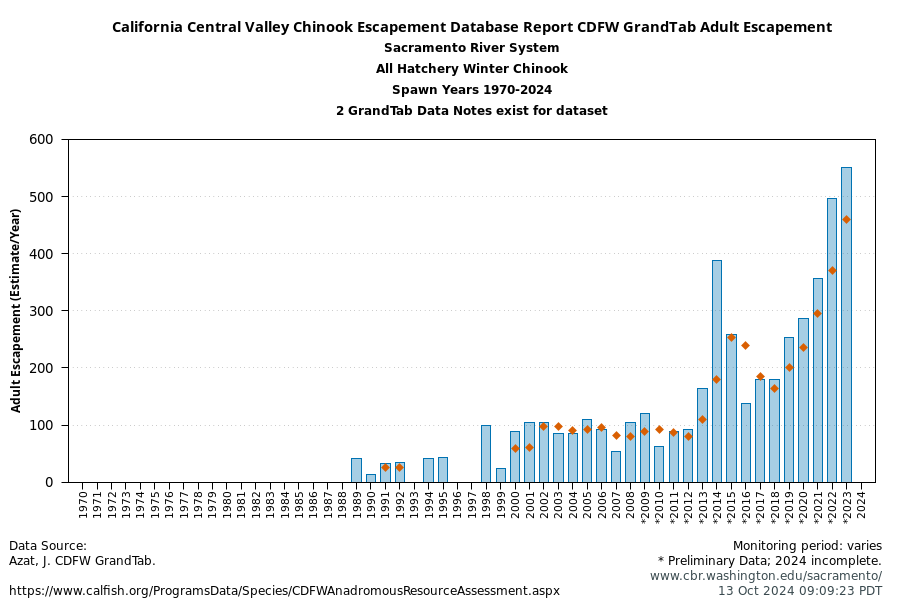
Adults in River
Adult Escapement — annual data