
Species | Red Bluff Diversion Dam | Tisdale RST | Knights Landing RST | Sac Trawl (Sherwood) | Chipps Island Trawl | Salvage |
|---|---|---|---|---|---|---|
Chinook, LAD Winter-run, Unclipped | 100% | 100% | 100% | 100% | 100% | 100% |
Chinook, DNA Winter-run, Unclipped (Water Year) | 100% |
Assessment for Delta Operations on Salmonids
Final: Tuesday, June 23, 2026 at 3 PM
For more detailed data on salmonid conditions in the Delta see corresponding webpage on SacPAS.
Executive Summary
Entrainment management season is active.
Annual Loss: 45 (0.43% of annual loss threshold) natural winter-run, 58 (4.45% of annual loss threshold) hatchery winter-run (Sac River), 265 natural steelhead, 1898 (29.02% of annual loss threshold) hatchery steelhead, 1075 (48.90% of annual loss threshold) spring-run surrogate yearlings (Coleman Late-Fall), and 0 (0.00% of annual loss threshold) spring-run surrogate YOY (Feather River Spring-Run).
Single-year Incidental Take Limit (ITL) Status: 45 (0.76% of 5,922 ITL) natural winter-run; 58 (4.46% of 1,301 ITL) hatchery winter-run (Sac River); 2 (3.85% of 52 ITL) hatchery winter-run (Battle Creek); 265 (5.01% of 5,294 ITL) natural steelhead.
Spring-run surrogate ITL status (0.5% per release group, BiOp Table 184): YOY - Feather River Hatchery (2026-03-18): 0 (0% of 4,927 ITL); YOY - Feather River Hatchery (2026-03-19): 0 (0% of 5,245 ITL); YOY - Feather River Hatchery (2026-03-23): 0 (0% of 2,441 ITL); Yearling - Coleman NFH (2025-11-13): 9 (1.21% of 717 ITL); Yearling - Coleman NFH (2025-11-17): 0 (0% of 376 ITL); Yearling - Coleman NFH (2025-12-17): 774 (33.02% of 2,344 ITL); Yearling - Coleman NFH (2025-12-22): 257 (84.64% of 304 ITL); Yearling - Coleman NFH (2026-01-08): 35 (12.26% of 286 ITL).
LAD winter-run presence in the Delta is decreasing based on historical Chipps Island Trawl monitoring.
Steelhead presence in the Delta is decreasing based on historical Chipps Island Trawl monitoring.
Natural Winter-run Chinook
Juvenile Production Estimate
The Juvenile Production Estimate for winter-run is 1,057,452 for the current water year.
Current Status
Delta Entry Timing - Historically, as of Jun 22, 100% of length-at-date (LAD) winter-run have entered the Delta based on Knights Landing RST catch, 100% have exited the Delta based on Chipps Island Trawl Catch, and 100% of DNA confirmed winter-run have been salvaged.
Red Bluff Diversion Dam Passage Estimate - As of Jun 10 estimated passage to date of LAD winter-run at Red Bluff Diversion is approximately 4.18 million fish. Note that outmigration timing overlaps with spring-run migrating fish, and true winter-run abundance likely differs from these estimates.
Delta Monitoring - No catch has been reported at Delta Entry RSTs (Tisdale, Knights Landing, Lower Sacramento River) in the past two weeks. Total catch at Sacramento Trawl and Beach Seines in the delta between Jun 10 and Jun 22 is 0 individuals. Total catch at Delta Exit at Chipps Island between Jun 10 and Jun 22 is 0 individuals.
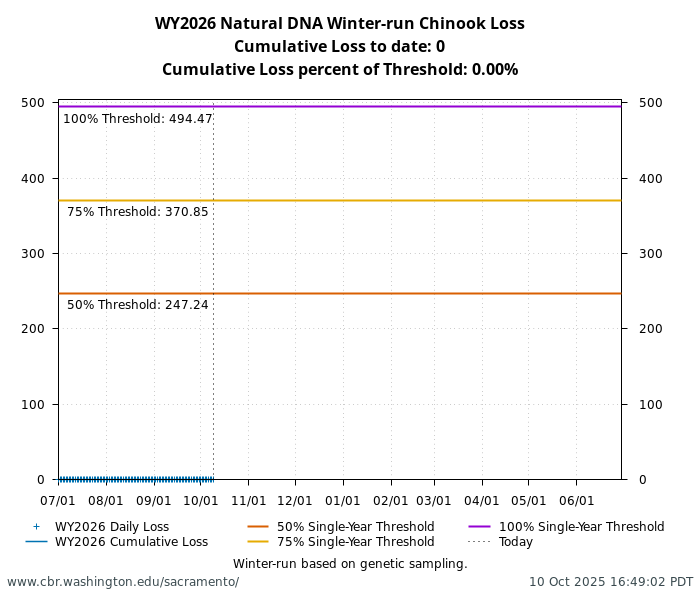
Annual Loss
The annual loss threshold for natural winter-run is 1% of the JPE or 10,575 fish. The single-year incidental take limit (ITL) is 0.56% of the JPE (5,922 fish) or 0.36% on a 3-year rolling average (BiOp Table 184). As of June 22, cumulative loss of genetically confirmed winter-run is 45 or 0.43% of the annual loss threshold. Cumulative loss in the past 7 days has been 0.
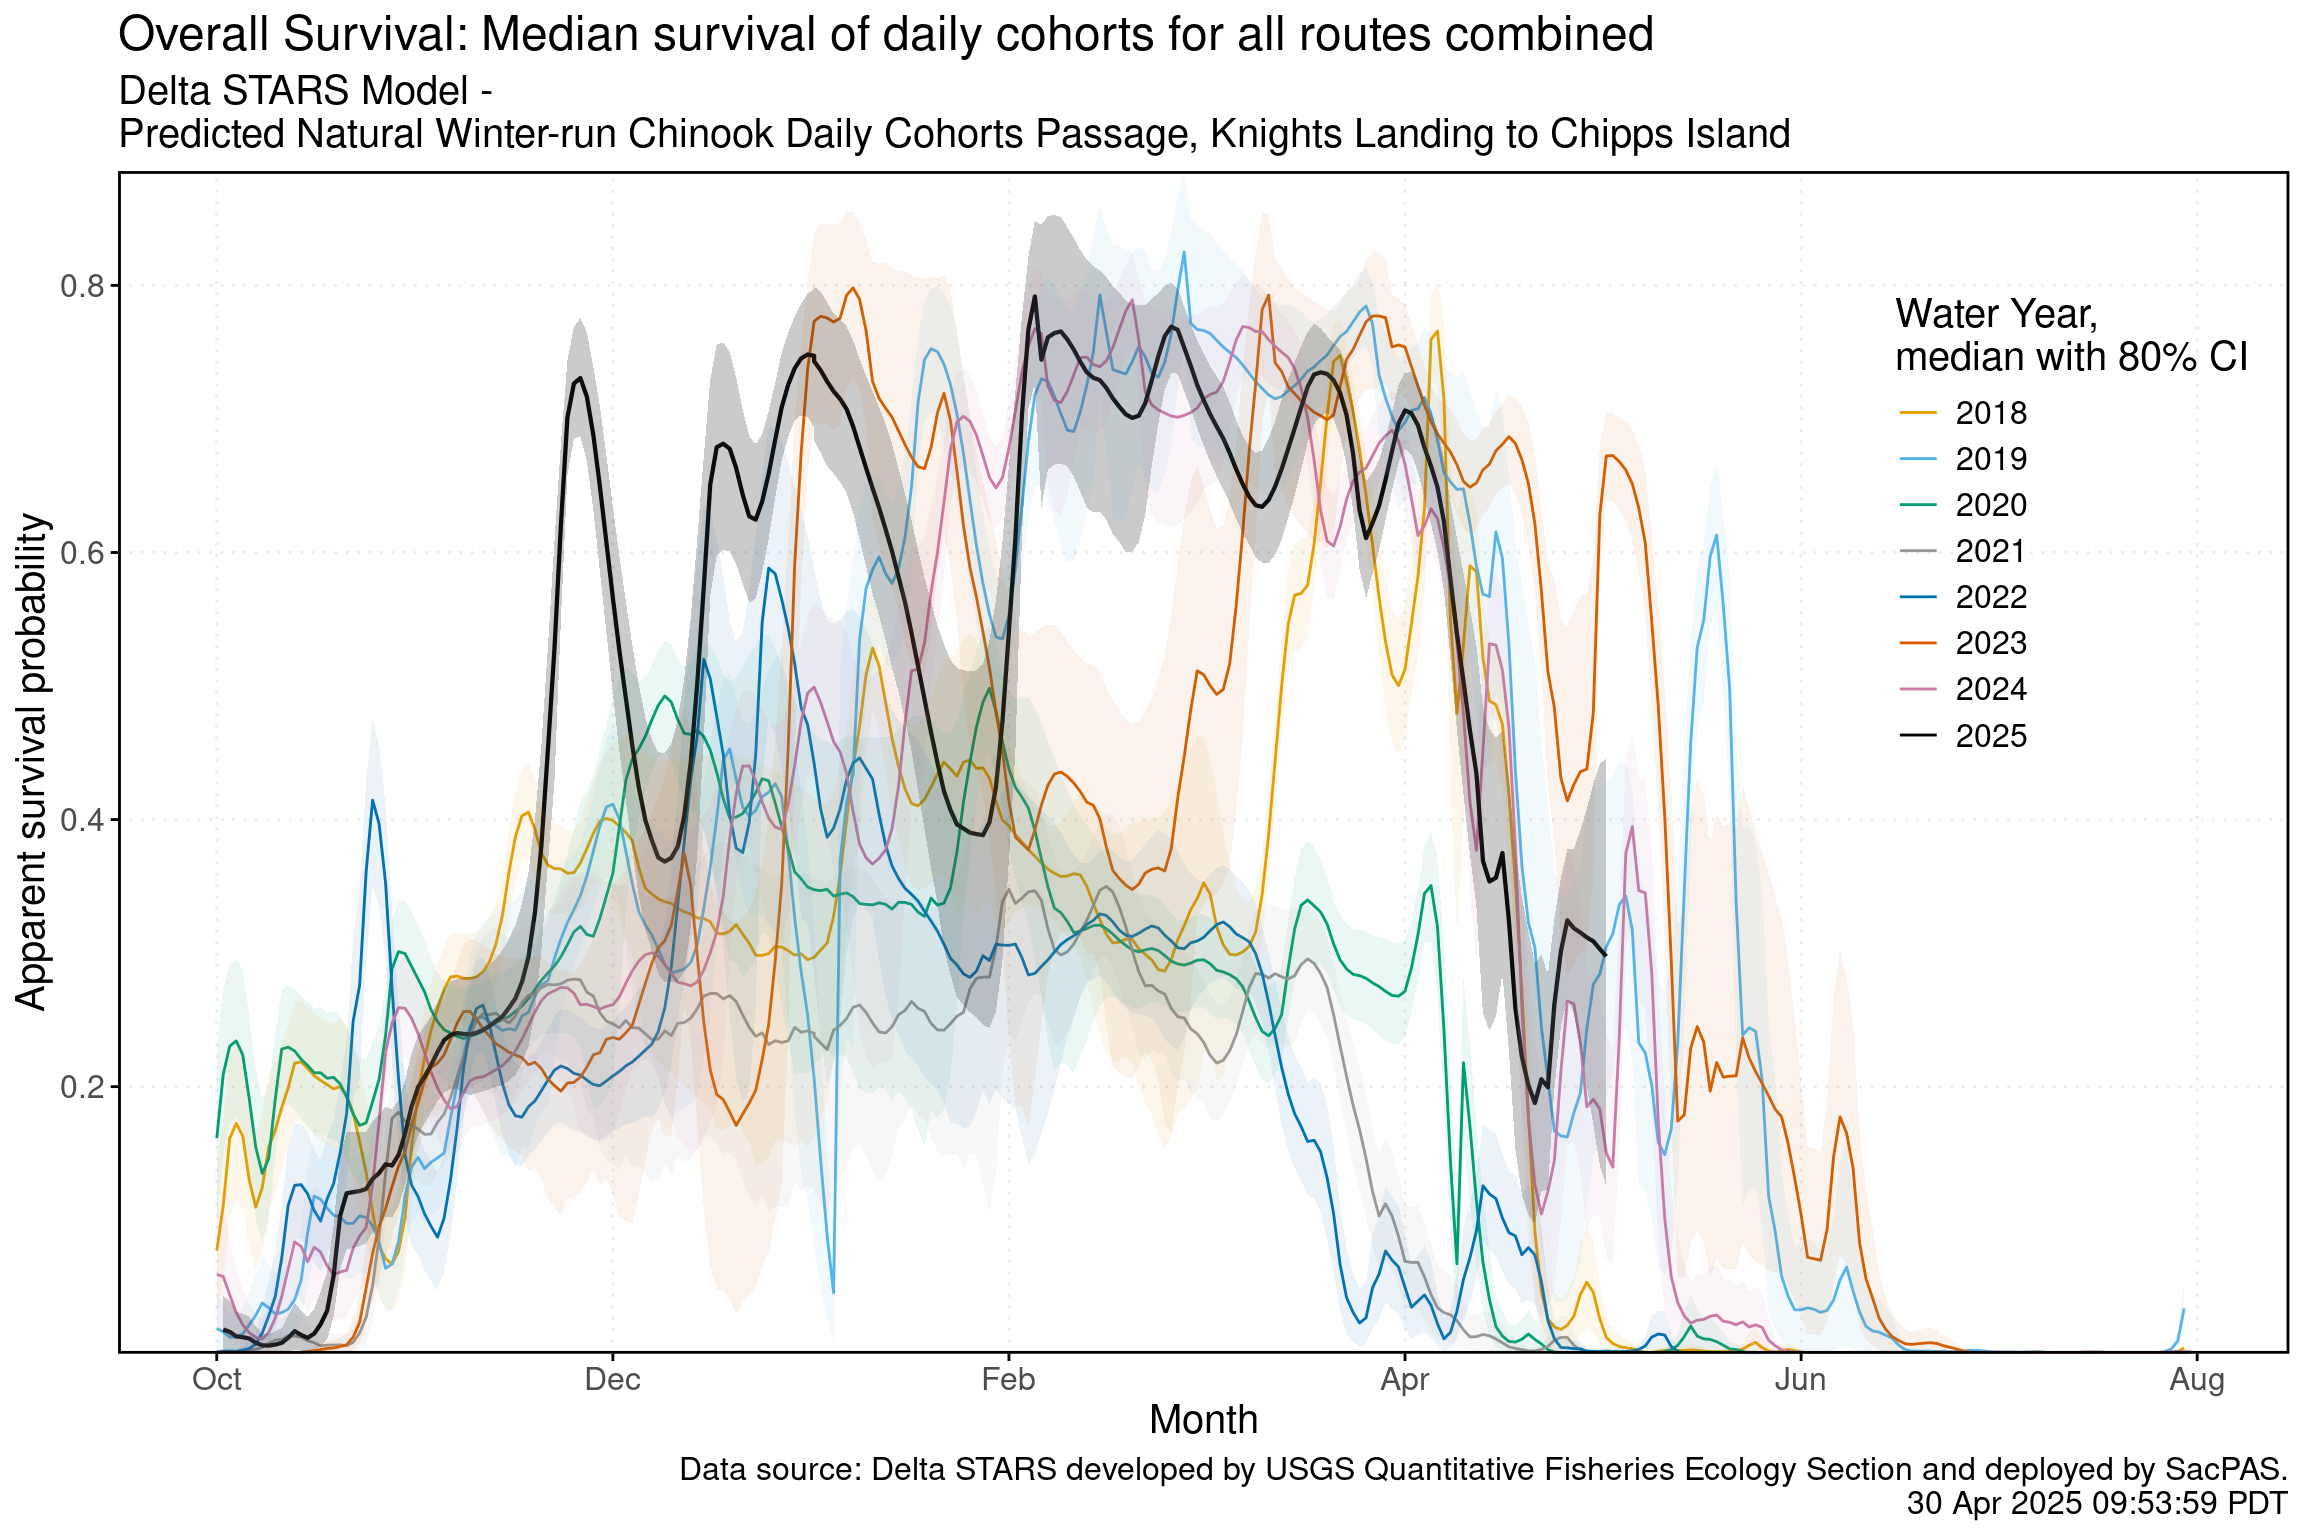
STARS
The Delta STARS Model is an individual-based simulation model that predicts survival, travel time, and routing of juvenile salmon migrating through the Sacramento–San Joaquin River Delta. This model gives insight into survival and routing patterns of winter-run based on most current conditions.
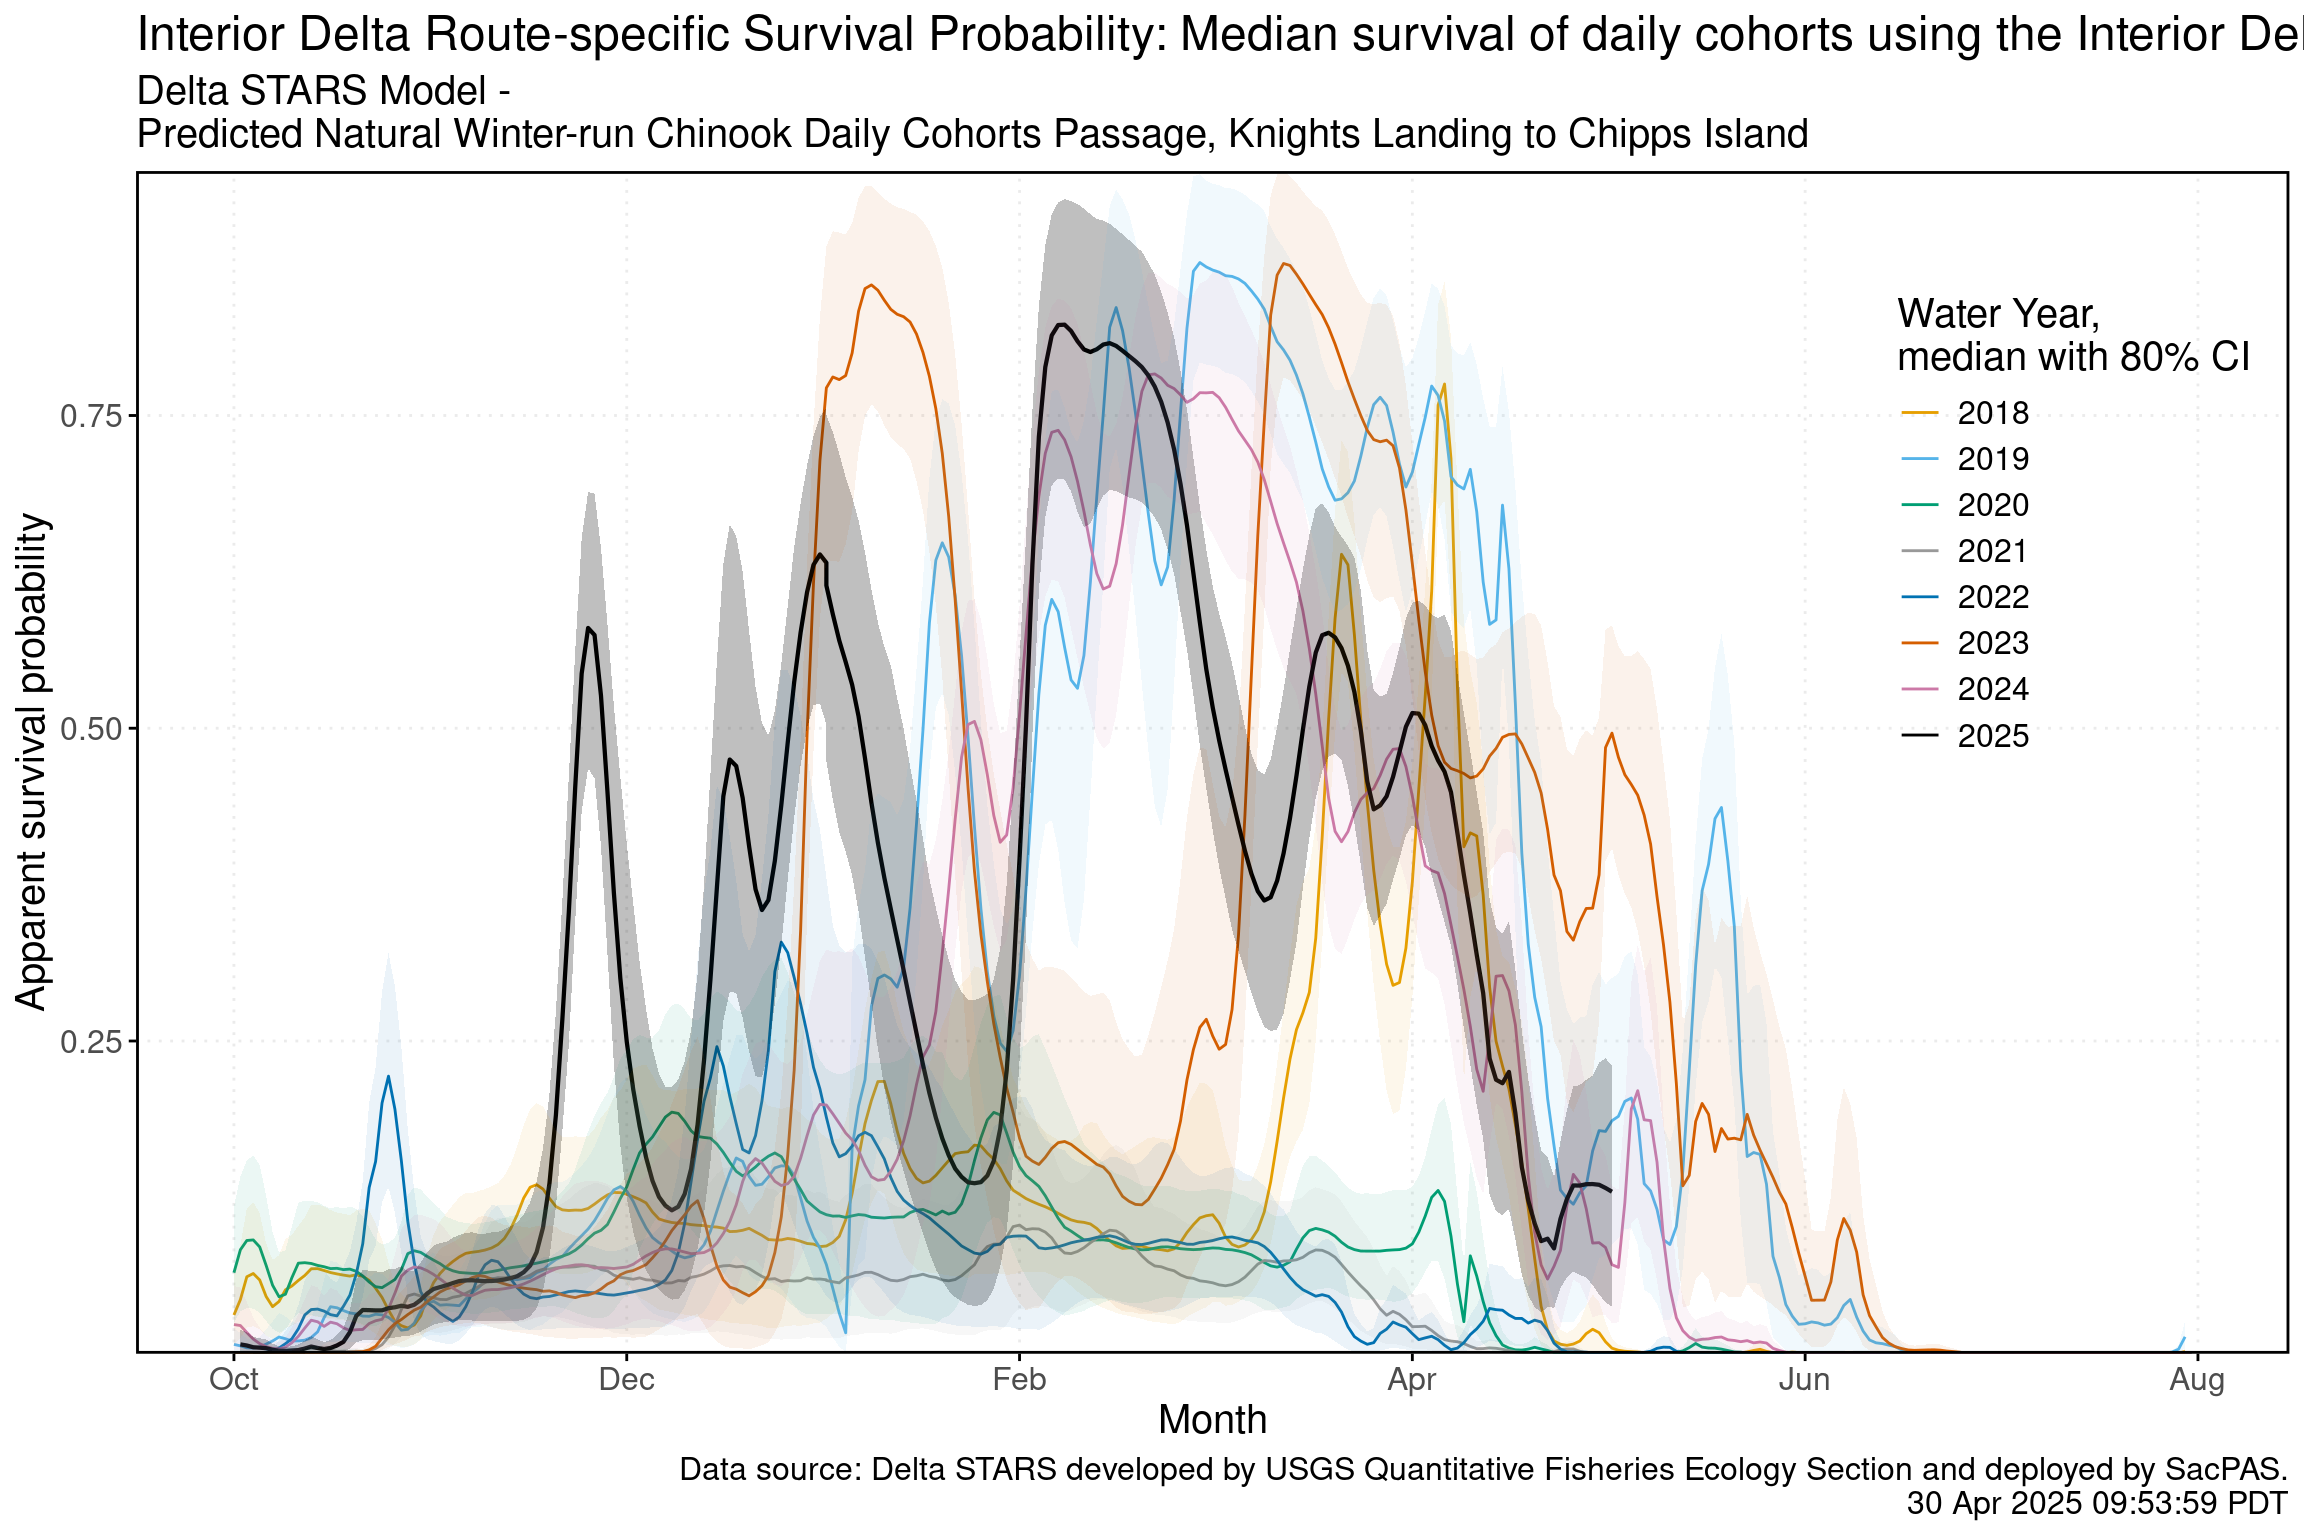
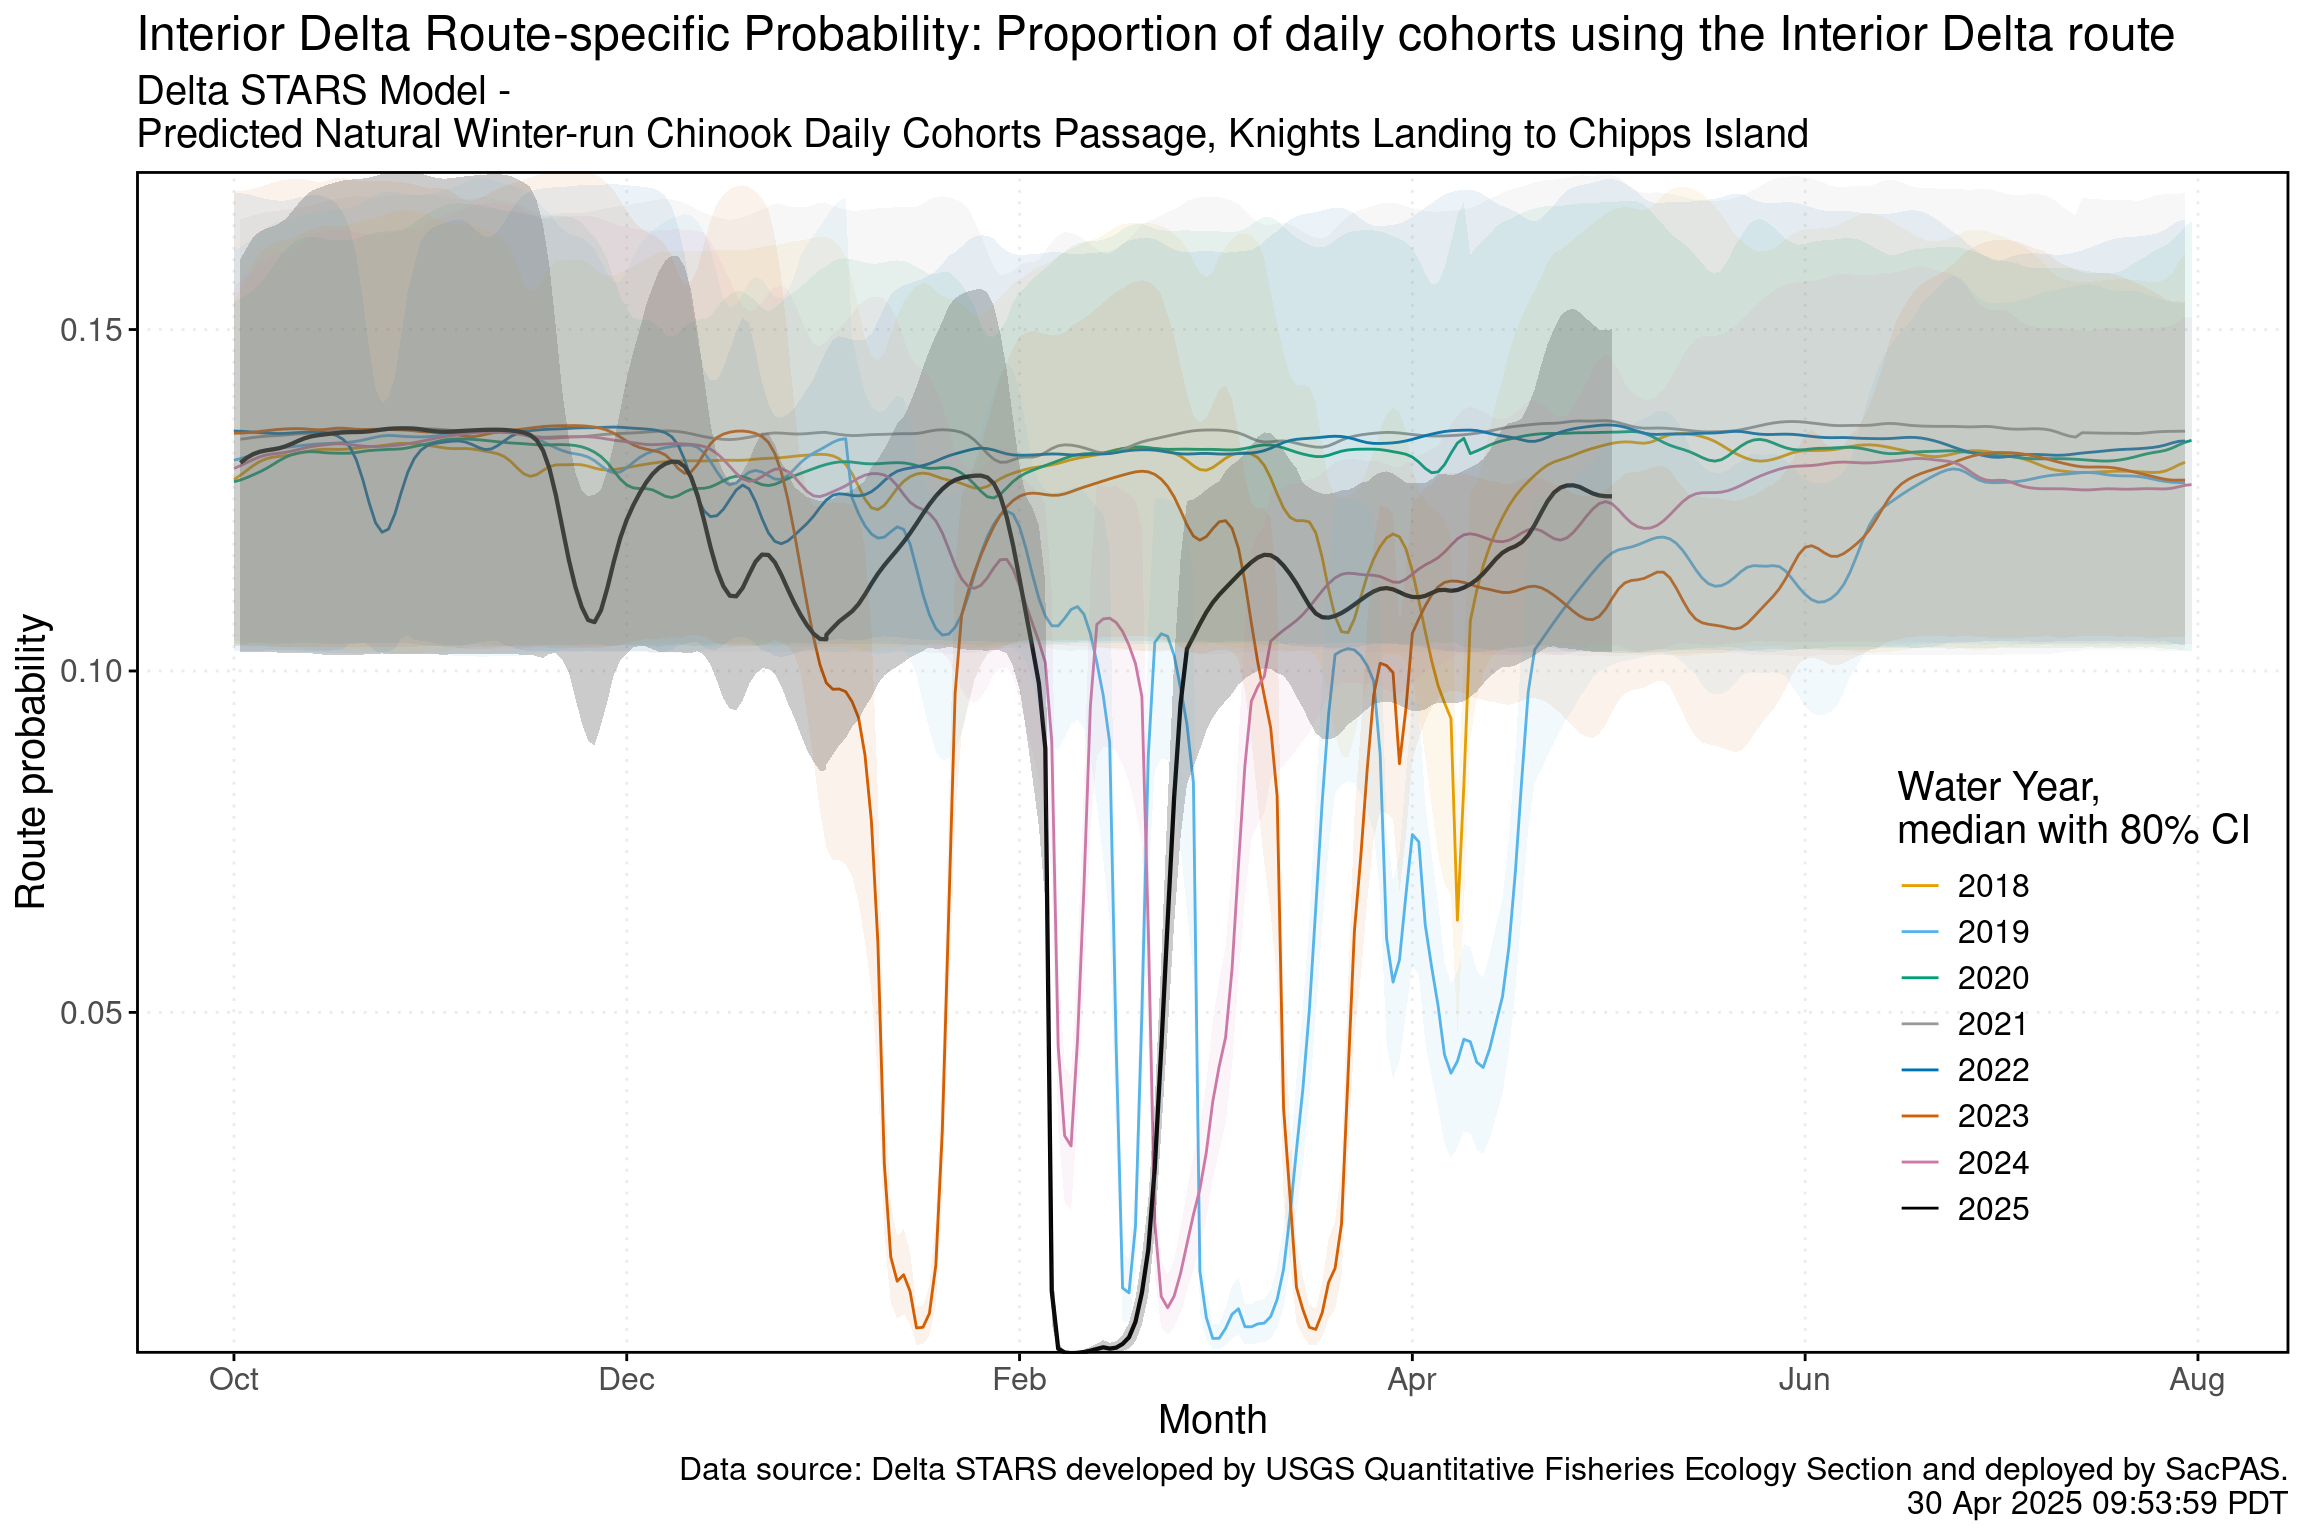
As of June 22, overall through delta STARS estimated survival probability (with 80% credible intervals) is 0 (0-0) placing it in the 72nd percentile of historical STARS survival estimates for the month of June (WYs 2018-2025). STARS estimated routing and survival probabilities (with 80% credible intervals) into the interior delta are 0.13 (0.1-0.16) and 0 (0-0), respectively, corresponding to the 19th and 74th percentiles of historical June estimates (WYs 2018-2025).
Hatchery Winter-run Chinook – Sacramento River
Hatchery Releases
Livingston Stone National Fish Hatchery released a total of 466,344 winter-run Chinook salmon (February 18). All fish were 100% CWT-marked production fish released at the Sacramento River at John F. Reginato River Access. Release details are shown in the table below and available on SacPAS.
Release Date | Hatchery | Release Site | Release Type | Fish Released | % CWT Marked | CWT Tagcodes |
|---|---|---|---|---|---|---|
February 18, 2026 | Livingston Stone NFH | Sacramento River at John F. Reginato River Access | Production | 466,344 | 100% | 053800 056770 056788 056789 |
Juvenile Production Estimate
The Juvenile Production Estimate for hatchery winter-run (Sacramento River releases) is 130,096 for Livingston Stone releases. The annual loss threshold is 1% of the JPE (1,301 fish), which is the same as the single-year ITL (BiOp Table 184).
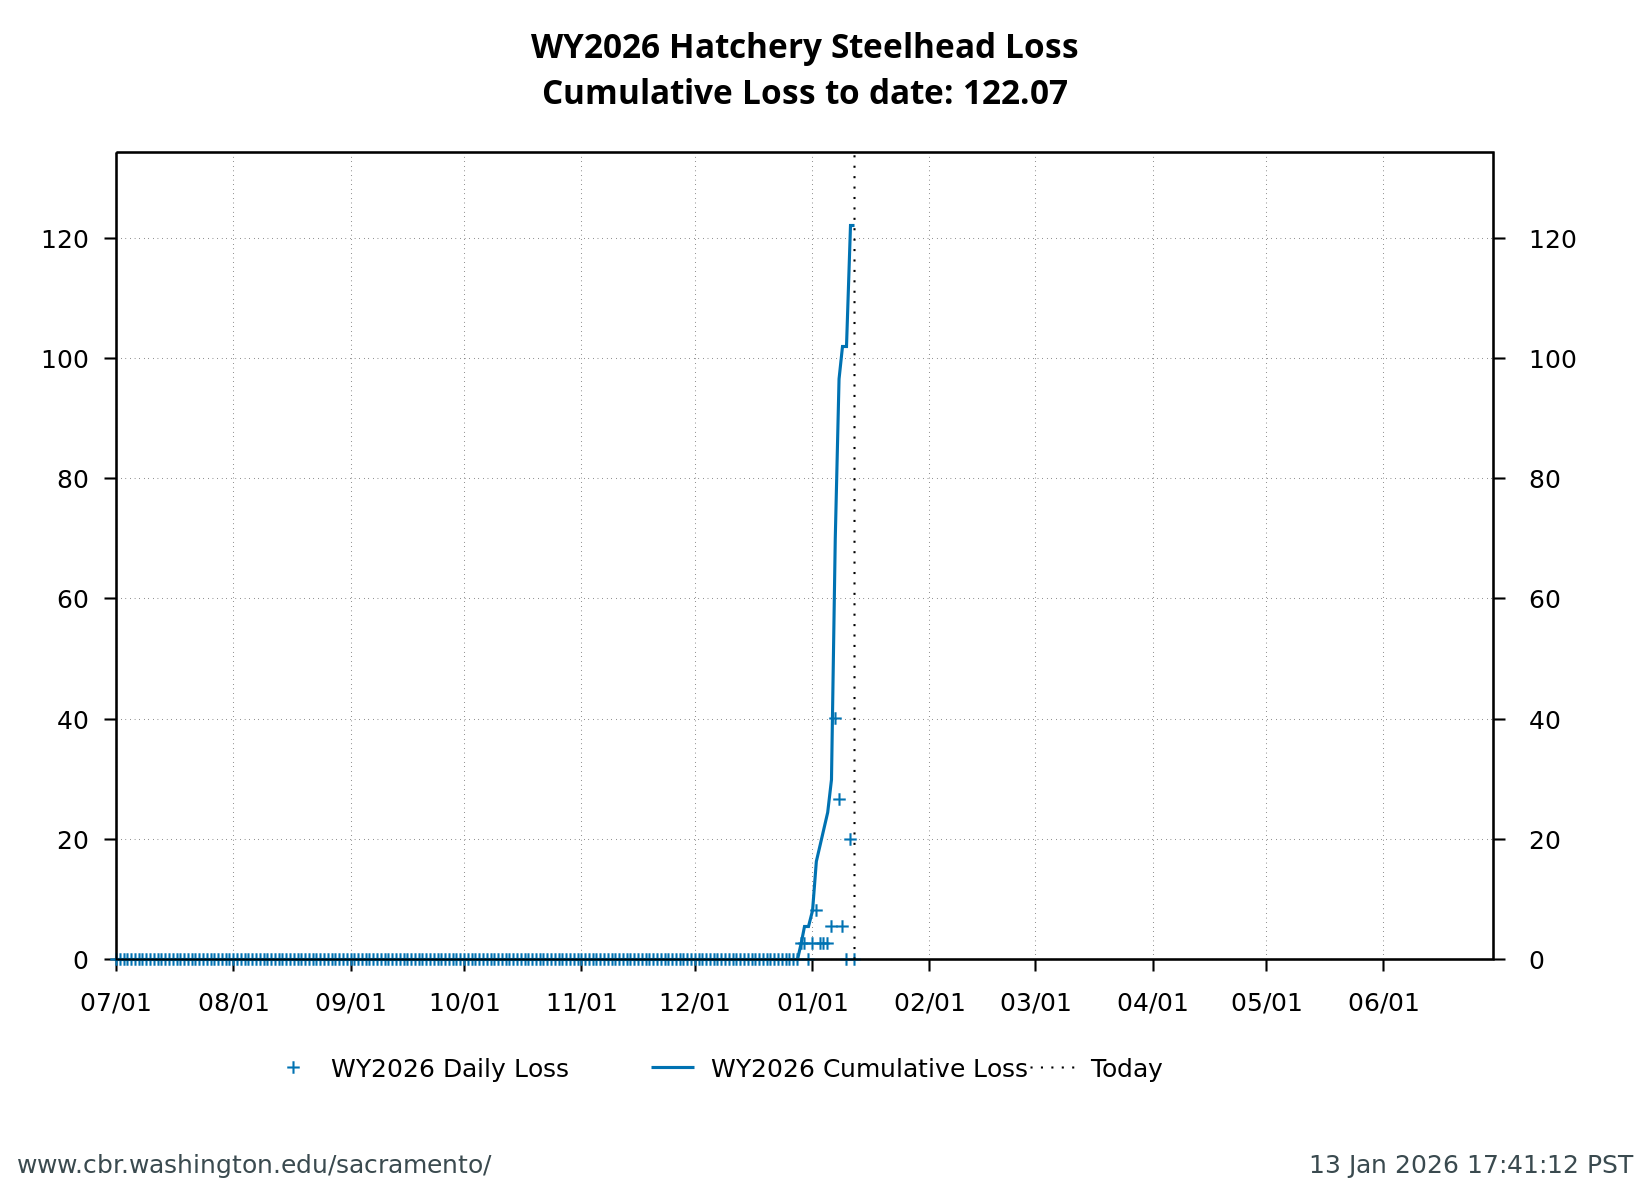
Annual Loss
As of June 23, cumulative loss of Livingston Stone hatchery fish (Sacramento River releases) is 58 or 4.45% of the annual loss threshold (which equals the single-year ITL). Cumulative loss in the past 7 days has been 0.
Hatchery Winter-run Chinook – Battle Creek
Hatchery Releases
Livingston Stone National Fish Hatchery released a total of 207,067 winter-run Chinook salmon into Battle Creek (February 19). Release details are available on SacPAS.
Release Date | Hatchery | Release Site | Release Type | Fish Released | % CWT Marked | CWT Tagcodes |
|---|---|---|---|---|---|---|
February 19, 2026 | Coleman NFH | North Fork Battle Creek Manton CA | Jumpstart | 207,067 | 100% | 056769 |
Juvenile Production Estimate
The Juvenile Production Estimate for hatchery winter-run released into Battle Creek is 5,186 based on 207,067 fish released. The single-year incidental take limit (ITL) is 1.0% of the JPE (52 fish) or 0.8% on a 3-year rolling average (BiOp Table 184).
Incidental Take
As of June 23, cumulative loss of Livingston Stone hatchery fish (Battle Creek releases) is 2 or 4.47% of the single-year ITL (52 fish). Cumulative loss in the past 7 days has been 0.
Natural-origin Central Valley Steelhead
Current Status
Delta Entry Timing - Historically, as of Jun 22, 98% of CCV steelhead have entered the Delta based on Knights Landing RST catch, 94% have exited the Delta based on Chipps Island Trawl Catch, and 100% have been salvaged.
Species | Chipps Island Trawl | Knights Landing RST | Red Bluff Diversion Dam | Sac Trawl (Sherwood) | Salvage | Tisdale RST |
|---|---|---|---|---|---|---|
Steelhead, Unclipped | 94% | 83% | 41% | 98% | 100% | 88% |
Delta Monitoring - No catch has been reported at Delta Entry RSTs (Tisdale, Knights Landing, Lower Sacramento River) in the past two weeks. Total catch at Sacramento Trawl and Beach Seines in the delta between Jun 10 and Jun 22 is 0 individuals. Total catch at Delta Exit at Chipps Island between Jun 10 and Jun 22 is 0 individuals.
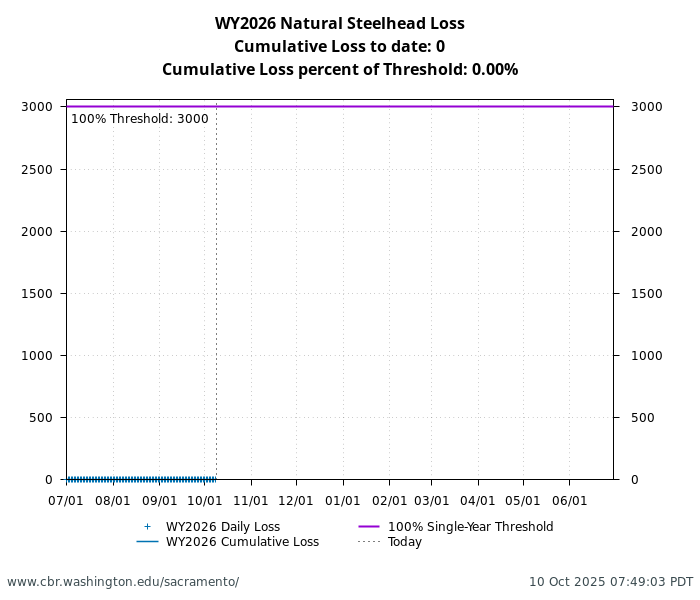
Annual Loss
As of June 22, cumulative loss of unclipped steelhead is 265 or 5.00% of the single-year incidental take limit (ITL). There is no annual loss threshold for natural steelhead. The single-year ITL is 5,294 juveniles or 2,319 juveniles as a 3-year rolling average (BiOp Table 184). Cumulative loss in the past 7 days has been 0.
Hatchery-origin Central Valley Steelhead
Surrogate Releases
There have been a total of 10 releases totaling 1,618,274 steelhead in Water Year 2026. JPE for the hatchery releases as of today is 654,130 based on estimated survivals using forecasted water year types (see details in table below). The annual loss threshold, equal to 1% of the JPE, is currently 6,541, but is subject to change with additional steelhead releases.
Hatchery | Date of Release | Number Released | Estimated Survival | Juvenile Production Estimate |
|---|---|---|---|---|
NIM | 2025-11-10 | 233,109 | 72% | 167,838 |
Coleman | 2025-12-15 | 555,720 | 38% | 211,174 |
Coleman | 2025-12-17 | 90,019 | 38% | 34,207 |
FRH | 2026-01-06 | 376,640 | 36% | 135,590 |
FRH | 2026-01-09 | 117,715 | 36% | 42,377 |
MOK | 2026-02-17 | 39,130 | 25% | 9,783 |
MOK | 2026-02-18 | 39,131 | 25% | 9,783 |
MOK | 2026-03-18 | 41,550 | 27% | 11,219 |
MOK | 2026-03-19 | 42,150 | 27% | 11,381 |
MOK | 2026-04-16 | 83,110 | 25% | 20,778 |
Hatchery | Survival Estimate | Source |
|---|---|---|
Coleman NFH | 0.205 – 0.433 | Sandstrom et al. 2020 |
Feather River Hatchery | 0.09 – 0.45 | Kurth 2013 |
Nimbus Hatchery | 0.62 – 0.83 | Brodsky et al. 2020 |
Mokelumne River Hatchery | 0.25 – 0.33 | Del Real et al. 2012 |
Total loss of hatchery-origin steelhead is 1898 or 29.02% of the annual loss threshold. Note that hatchery origin of salvaged fish cannot be determined at this time and salvage is based on the assumption of similar routing and survival probabilities of individual hatchery releases.
Spring-run Chinook
Current Status
Delta Entry Timing - Historically, as of Jun 22, 100% of LAD spring-run have entered the Delta based on Knights Landing RST catch, 100% have exited the Delta based on Chipps Island Trawl Catch, and 100% have been salvaged.
Species | Red Bluff Diversion Dam | Tisdale RST | Knights Landing RST | Sac Trawl (Sherwood) | Chipps Island Trawl | Salvage |
|---|---|---|---|---|---|---|
Chinook, LAD Spring-run, Unclipped | 100% | 100% | 100% | 100% | 100% | 100% |
Red Bluff Diversion Dam Passage Estimate - As of Jun 10 estimated passage to date of LAD spring-run at Red Bluff Diversion is approximately 0.96 million fish. Note that outmigration timing overlaps with winter-run and fall-run outmigration, and true spring-run abundance likely differs from these estimates.
Delta Monitoring - No catch has been reported at Delta Entry RSTs (Tisdale, Knights Landing, Lower Sacramento River) in the past two weeks. Total catch at Sacramento Trawl and Beach Seines in the delta between Jun 10 and Jun 22 is 0 individuals. Total catch at Delta Exit at Chipps Island between Jun 10 and Jun 22 is 0 individuals.
Spring-run Surrogate Releases
A total of 3,327,812 spring-run surrogate fish have been released in Water Year 2026, with an estimated Juvenile Production Estimate (JPE) of 1,130,892 fish entering the Delta. This includes 805,323 Coleman Late-Fall Run Chinook yearlings (JPE: 219,852) released from Coleman National Fish Hatchery across 12 coded-wire tag groups, and 2,522,489 Feather River Hatchery Spring-Run young-of-year (JPE: 911,040) across 7 coded-wire tag groups. See details in table below.
Hatchery | Release Date | Stock | Life Stage | Type | CWT Released | JPE | ITL (0.5%) | Loss | CWT Codes |
|---|---|---|---|---|---|---|---|---|---|
Feather River Hatchery | 2026-03-18 | Spring-Run | YOY | Production | 985,324 | 355,866 | 4,927 | 0 | 063227, 063229 |
Feather River Hatchery | 2026-03-19 | Spring-Run | YOY | Production | 1,048,948 | 378,846 | 5,245 | 0 | 063036, 063236, 063239 |
Feather River Hatchery | 2026-03-23 | Spring-Run | YOY | Production | 488,217 | 176,328 | 2,441 | 0 | 062858, 063234 |
Coleman NFH | 2025-11-13 | Late-Fall | Yearling | Production | 143,346 | 39,134 | 717 | 9 | 056808, 056809 |
Coleman NFH | 2025-11-17 | Late-Fall | Yearling | Experimental | 75,119 | 20,507 | 376 | 0 | 056810 |
Coleman NFH | 2025-12-17 | Late-Fall | Yearling | Production | 468,876 | 128,002 | 2,344 | 774 | 053700, 056806, 056811, |
Coleman NFH | 2025-12-22 | Late-Fall | Yearling | Experimental | 60,873 | 16,618 | 304 | 257 | 056813 |
Coleman NFH | 2026-01-08 | Late-Fall | Yearling | Experimental | 57,109 | 15,591 | 286 | 35 | 056816 |
Annual Loss
The annual loss threshold (Action 5) is 1% of the JPE entering the Delta, tracked cumulatively but separately for yearlings and young-of-year. Yearling surrogates (Coleman Late-Fall): the threshold is 2,199 fish; as of June 22, cumulative loss is 1,075 fish or 48.90% of the threshold. YOY surrogates (Feather River Spring-Run): the threshold is 9,110 fish; as of June 22, cumulative loss is 0 fish or 0.00% of the threshold. The single-year incidental take limit (ITL) is 0.5% of the estimated number of each surrogate release group (BiOp Table 184). ITL status by release group: YOY - Feather River Hatchery (2026-03-18, Production): 0 loss of 4,927 ITL (0%); YOY - Feather River Hatchery (2026-03-19, Production): 0 loss of 5,245 ITL (0%); YOY - Feather River Hatchery (2026-03-23, Production): 0 loss of 2,441 ITL (0%); Yearling - Coleman NFH (2025-11-13, Production): 9 loss of 717 ITL (1.21%); Yearling - Coleman NFH (2025-11-17, Experimental): 0 loss of 376 ITL (0%); Yearling - Coleman NFH (2025-12-17, Production): 774 loss of 2,344 ITL (33.02%); Yearling - Coleman NFH (2025-12-22, Experimental): 257 loss of 304 ITL (84.64%); Yearling - Coleman NFH (2026-01-08, Experimental): 35 loss of 286 ITL (12.26%)
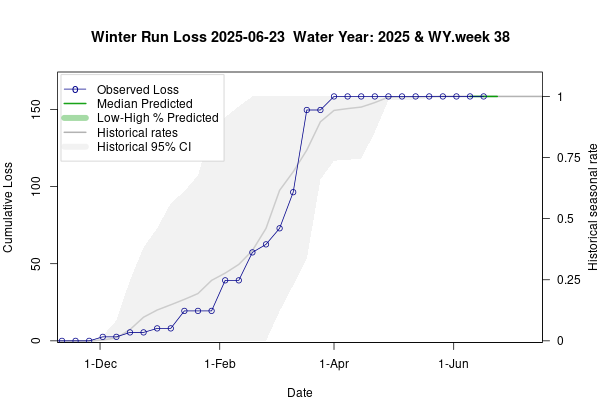
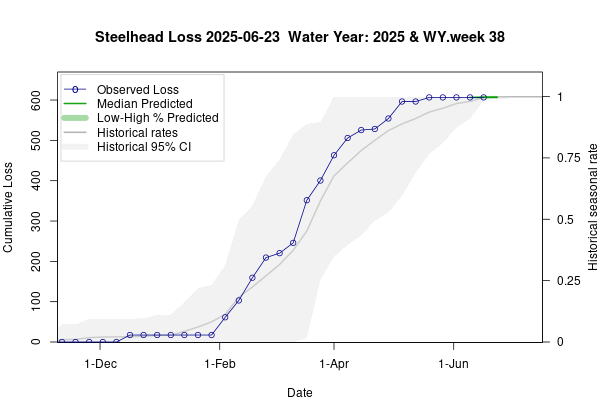
Loss Prediction and Trajectories
The following figures display the current loss predictor model outputs for winter-run Chinook salmon and steelhead.
End of Entrainment Management for Salmonids
The end of entrainment management for salmonids occurs on June 30, or after 7 days of daily mean water temperature in June ≥ 72° F (22° C) at Mossdale and at Prisoner’s Point (does not have to be consecutive), whichever occurs first.

Evaluation
What is the probability of exceeding natural or hatchery winter-run Chinook salmon loss thresholds in the upcoming week?
LOW RISK: Natural winter-run cumulative loss is currently 0.43% of the threshold. LOW RISK: Hatchery winter-run (Sac River) cumulative loss is currently 4.45% of the threshold. LOW RISK: Hatchery winter-run (Battle Creek) cumulative loss is currently 4.47% of the threshold.
What is the probability of exceeding spring-run Chinook salmon surrogate loss thresholds (yearling and YOY) in the upcoming week?
LOW RISK: Spring-run surrogate yearlings (Coleman Late-Fall) cumulative loss is currently 48.90% of the threshold. LOW RISK: Spring-run surrogate YOY (Feather River Spring-Run) cumulative loss is currently 0.00% of the threshold.
What is the probability of exceeding natural or hatchery steelhead loss thresholds in the upcoming week?
LOW RISK: Natural steelhead cumulative loss is currently 5.00% of the threshold. LOW RISK: Hatchery steelhead cumulative loss is currently 29.02% of the threshold.
References
Brodsky, A., Zeug, S. C., Nelson, J., Hannon, J., Anders, P. J., & Cavallo, B. J. (2020). Does broodstock source affect post-release survival of steelhead? Implications of replacing a non-native hatchery stock for recovery. Environmental Biology of Fishes, 103(5), 437–453.
Del Real, S. C., Workman, M., & Merz, J. (2012). Migration characteristics of hatchery and natural-origin oncorhynchus mykiss from the lower mokelumne river, california. Environmental Biology of Fishes, 94(2), 363–375.
Kurth, R. (2013). Downstream migration success of feather river fish hatchery steelhead smolts under different release strategies.
Sandstrom, P. T., Ammann, A. J., Michel, C., et al. (2020). Low river survival of juvenile steelhead in the sacramento river watershed. Environmental Biology of Fishes, 103(5), 531–541.